Key takeaways
- An edge that wins consistently costs a counterparty money, and that counterparty tends to change its behavior over time.
- When a pattern becomes known, more participants trade it and the margin is split until it is small.
- A historical average can hide recent decline, so calculate expectancy period by period.
- A rolling measure over recent trades shows a strategy's current shape, though it reacts with a delay.
- Writing the threshold and the action in advance keeps you from deciding on emotion during a losing streak.
A strategy wins for a while and then stops winning. The person running it usually notices the change long before they can explain it: first they blame execution, then a bad streak, and only at the end do they ask whether the pattern still exists.
The deeper question is different: why does a statistical edge lose strength over time, and how do you watch it live without relying on patterns that only made sense in the past.
An edge that works well costs someone money, and that someone eventually learns.
If a strategy wins, someone on the other side loses
Every trade has two sides. When one party buys, another sells, and when a strategy wins, the counterparty loses that same money. This sounds obvious, but it changes how you think about an edge. A pattern that pays consistently is not a gift from the market. It is a transfer of money from someone who acts with worse rules or less information.
In plain terms, it is a two-player game. If one side always wins with the same move, the other side has a clear incentive to change its own. The losing side does not stay still indefinitely. It adjusts its behavior, reduces size, changes its hours or copies the profitable move.
So before asking how long a pattern will last, ask who is paying for it and why that party would keep paying.
The other side learns, and the edge flattens
Once a pattern becomes known, it stops being a private advantage. Many participants start trading the same signal at the same time, and the price moves before the signal reaches its entry point. This is called crowding. The edge does not vanish at once. It is split among more people until it is small.
Learning also happens outside the market. Traders who lose with a strategy review their accounts, change their rules or hire someone to study it. Each change shrinks the gap the pattern originally exploited. An academic study of stock return predictability found that the profitability of many patterns declines after they are published.
There is a double effect worth naming. An idea can survive for a while because few people execute it well, and then lose strength once execution becomes common. What degrades is not always the idea. Sometimes it is the margin that was left after everyone copied it. Not every edge wears out at the same pace. Edges that need costly infrastructure, hard-to-get data or very precise execution take longer to reach many participants, which is why some last for years while others are used up in months.
Measure by period: the example an average hides
A ten-year average can hide a recent decline. If a rule did very well in its early years and poorly in its latest ones, the average looks healthy and the current reality is different. The useful measure is the same metric calculated in slices: by year, by quarter or by blocks of trades.
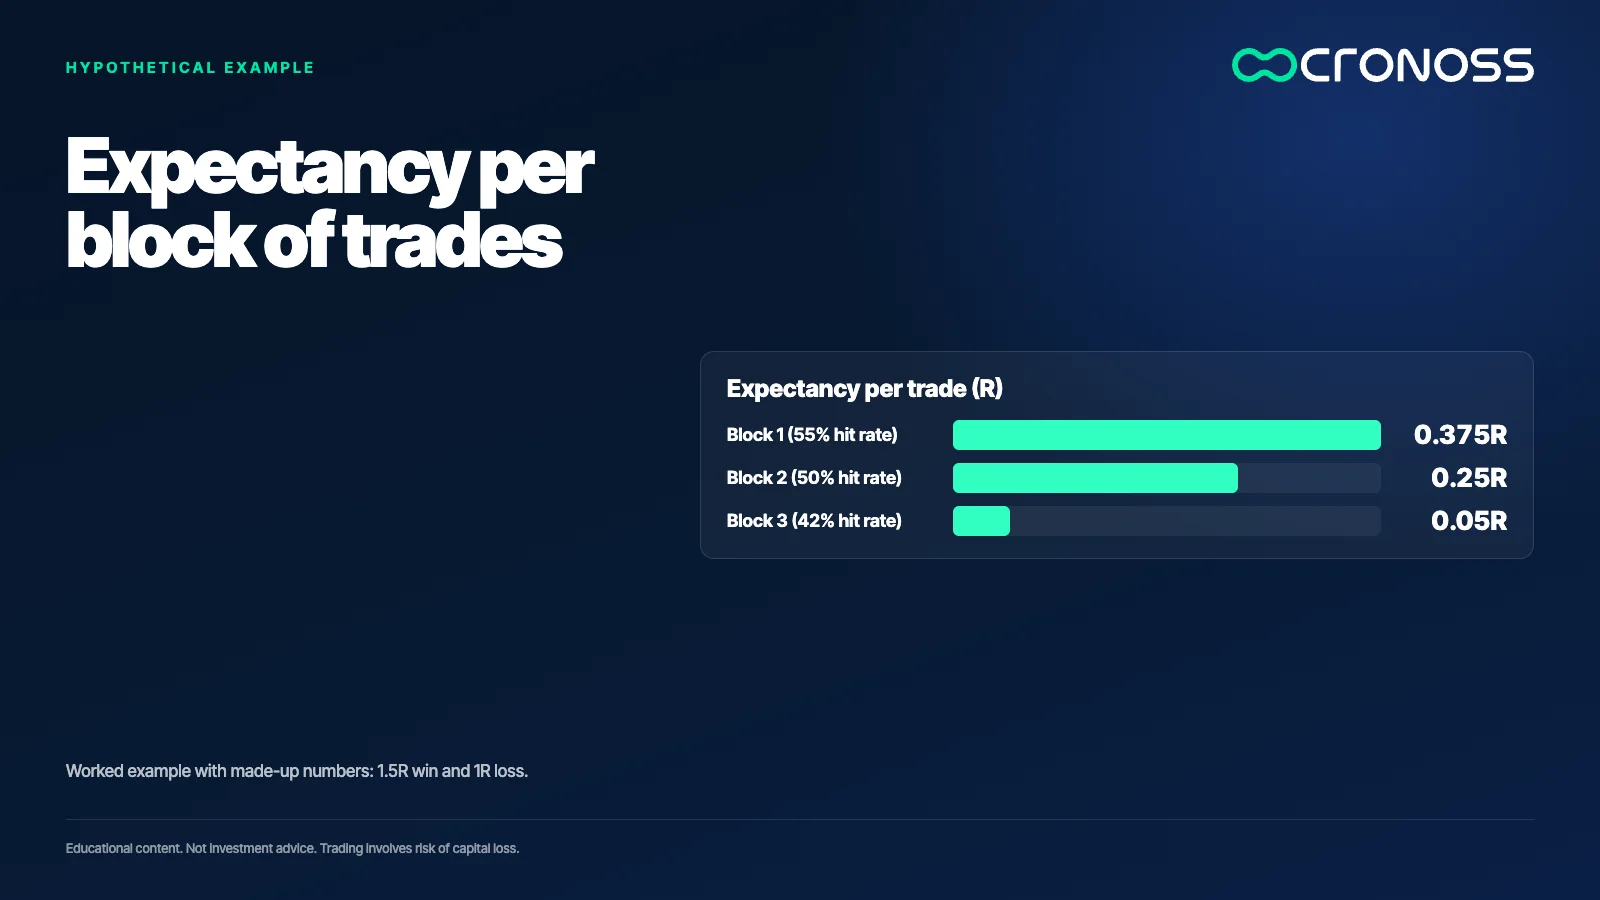
Worked example (made-up numbers). A rule wins 1.5R when it is right and loses 1R when it is wrong. In the first block of 120 trades it is right 55% of the time: 0.55 × 1.5 − 0.45 × 1 = 0.375R per trade. In the second block it is right 50% of the time: 0.5 × 1.5 − 0.5 × 1 = 0.25R. In the third it is right 42% of the time: 0.42 × 1.5 − 0.58 × 1 = 0.05R. The average of the three blocks is 0.225R, but the latest window is almost at break-even.
No single block proves anything on its own, because 120 trades still carry noise. The signal lies in the trend across blocks, not in one bad month.
Rolling measures: watch the recent window
A rolling measure recalculates the metric over the last N trades and advances by one trade each time. With N equal to 120, each new trade enters the calculation and the oldest one leaves. The strategy is then measured on its recent data, not only on its full history.
It helps to watch three measures in parallel: hit rate, expectancy in R and the average size of losses. If the hit rate falls but expectancy holds, the system has changed shape. If losses are getting longer, something changed in execution or in the environment. Each measure says something different, and looking at only one gives an incomplete picture. If expectancy falls while the hit rate rises, review the size of the wins and the way you exit, not only the entry signal.
Rolling measures have a cost: they react with a delay and can raise false alarms during normal streaks. The protection is to set in advance how much deviation counts as abnormal, instead of deciding when it hurts.
A rule written in advance to reduce or retire
Someone who decides while losing usually decides badly. The way out is to write, before trading live, what will happen if the strategy degrades. The rule must be concrete: which measure is watched, over which window, which threshold triggers each action and who applies it.
An example of structure, not a recommendation of thresholds: if expectancy over the last 120 trades falls below the defined threshold, size is cut in half. If it stays there for two consecutive windows, the rule is retired for review. Running a strategy that is degrading can cost real money, and the rule exists to limit that loss.
Reducing size is different from switching off. Reducing keeps some exposure while the problem is investigated and avoids extreme decisions based on a short streak. Retiring is the answer when the evidence stops supporting the idea.
Ghost patterns: they look like an edge and have none
A ghost pattern is a rule that appears to have an edge in the data but has no statistical support. It appears when many combinations are tested on the same history, when there are too few trades or when the explanation is written after the result.
The problem with multiple testing is arithmetic. At a 5% significance level, testing 200 rules with no real edge, you should expect about 10 to look significant by pure chance. Worked example with made-up numbers: 200 × 0.05 = 10 expected false positives. If you trade only the best of those ten, the story you tell will be about an edge that never existed. The academic literature on return factors reaches a similar conclusion: with so many tests, the threshold for calling a result significant has to be stricter.
The defense is to keep a log of every test, including the failed ones, and to require that the rule works on data that was not used to design it. A rule that only works in the stretch that inspired it is, in practice, a ghost pattern.
Three questions before you trust a rule
- Who pays for this edge? If you cannot name the other side or explain why it would keep losing, be skeptical of the rule.
- What does it look like by period? Calculate expectancy per block of trades. If the latest window is close to zero, do not judge the rule by its average.
- What happens if it degrades? Write the threshold, the window and the action before you trade live.
An edge is watched, not inherited
An edge does not stay alive because it worked in the past. It is measured in every period, watched with rolling measures and reduced or retired under rules written before the first serious loss. The most honest last question is this: if the edge exists, who is paying for it today?
If you want to build the foundations for measuring a rule from scratch, the program Fundamentos del Trading Sistemático (Fundamentals of Systematic Trading) covers these concepts in order: Fundamentos del Trading Sistemático.
Educational content. Cronoss is not a broker, investment firm or financial adviser, and nothing above is an investment recommendation.
Frequently asked questions
Why does a strategy that worked for years stop working?
Because a consistent edge costs someone on the other side money, and that participant tends to learn, change its behavior or copy the move. When many people trade the same thing, the margin is split and shrinks. That is why an edge needs monitoring, not just a good backtest story.
How do you monitor an edge live?
Calculate the same metric by period and over a rolling window of recent trades, for example the last 120. Compare hit rate, expectancy in R and the size of losses against what the original research showed. Write the alert thresholds before you trade.
What is a ghost pattern?
It is a rule that appears to have an edge in the data but has no statistical support. It usually comes from testing many combinations on the same history or from having too few trades. The defense is to log every test and validate the rule on data that was not used to design it.
When should you reduce or retire a rule?
Reduce size when a recent measure crosses a threshold defined in advance, and retire the rule if the degradation persists across consecutive windows. Both steps should be written down before you trade live. That way the decision depends on evidence, not on a short streak.