Key takeaways
- A trading algorithm is an ordered sequence of steps with three layers: entry signal, exit signal and risk management.
- Programming is no longer the barrier: the real difficulty is market logic and measuring whether it works.
- Profit factor ties win rate and reward to risk in one formula, and very different strategies can share the same break-even point.
- Losing streaks are part of the math, especially with low win rates.
- Costs and the data used can trim or change a backtest result.
- With few trades the observed hit rate is unreliable: 40 trades leave a margin of error near 7.7 points.
- A martingale raises size after losses and concentrates risk in deep drawdowns.
Talking about a trading algorithm tends to trigger one of two reactions: fascination with a machine that trades by itself, or distrust of everything promised on social media. Both come from the same place, not knowing what is inside.
A trading algorithm is less mysterious than it looks. It is a recipe with clear steps, and judging whether it works takes less programming and more reading of a handful of metrics.
Programming was never the barrier to having a trading algorithm: the barrier is understanding market logic and honestly measuring whether that logic works.
An algorithm is a recipe with ordered steps
An algorithm is an ordered, defined and finite sequence of logical steps to solve a problem or carry out a task. We use them without noticing. If a lamp does not light, we ask whether it is plugged in; if it is, whether the bulb is burned out; if not, it is time to buy another. A cooking recipe works the same way: the same steps, in the same order, give the same taste.
Algorithmic trading applies that logic to market decisions. The difference is that the sequence is written once and a machine runs it the same way every time.
Every trading algorithm has three layers
Whatever the strategy, almost all of them are organized into three blocks: the entry signal (which condition opens a trade), the exit signal (which condition closes it) and management (how much to risk, meaning position size). Visual platforms show this architecture split into blocks, and it helps you understand any robot, even someone else's.
A good question for any system is whether all three layers are defined. If risk management is missing, the algorithm is incomplete, however brilliant the signal.
The programming language matters less than it seems
Languages are ranked by how close they are to human language or to machine language. High-level ones such as Python are easier to read and share; low-level ones are faster and far harder. Almost any of them can connect to a market, because brokers offer interfaces (APIs) that separate the code from execution: the program produces a signal and sends it in a standard format.
Speed really matters only in high-frequency strategies. In the research stage the opposite holds: a readable language that other people can review.
Programming is no longer a requirement
Block-based platforms, no-code or low-code, let you assemble the logic by dragging pieces and export the resulting code. Artificial intelligence also writes logic on request. That lowers the technical barrier but leaves the real one untouched: knowing which market logic makes sense, how to limit risk and what to do when the market changes behavior.
A robot that is easy to build is not a robot that works. How easy it is to build also explains why so many unsupported promises circulate.
A signal needs information that is not redundant
The best-known indicators (RSI, MACD, Bollinger Bands, stochastic) are all computed from the same price. They are different filters over the same image. Combining two of them usually adds redundancy, not confirmation, because both repeat what price was already saying.
That is why algorithm designers look for data of a different nature, such as volume, which measures how much participation stood behind the move. In forex there is a caveat: real volume exists only on centralized exchanges, and what many brokers report is a tick count. It pays to know which of the two you are working with.
The metrics: reward to risk, win rate and profit factor
After a backtest you need to look at a few metrics. Three of the simplest:
- Reward to risk. The distance to the target divided by the distance to the stop. It is the most quoted metric on social media and, used alone, proves nothing.
- Win rate. The percentage of winning trades. A low win rate is not a flaw if reward to risk compensates, but it produces long losing streaks.
- Profit factor. Gross profit divided by gross loss. A value of 1 is the theoretical break-even before commissions.
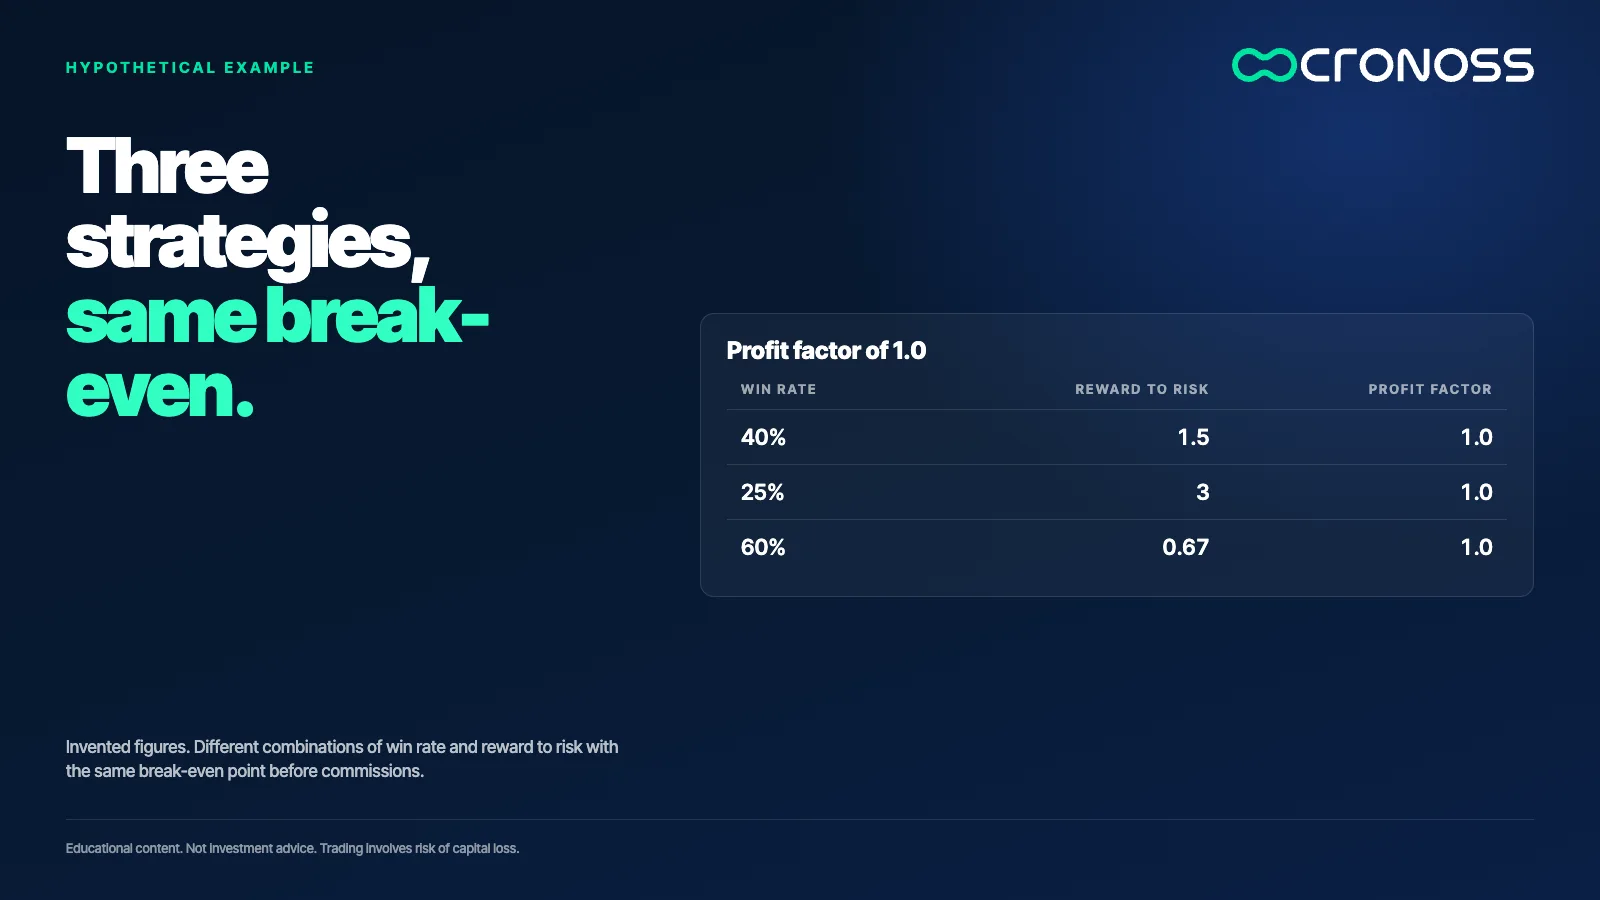
The three are tied by a formula: profit factor = win rate ÷ (1 − win rate) × reward to risk. With made-up numbers: winning 40% with a reward to risk of 1.5 gives (0.4 ÷ 0.6) × 1.5 = 1.0. Winning 25% with a reward to risk of 3 also gives 1.0. And winning 60% with 0.67 does too. Very different strategies, the same break-even point.
A losing streak is a normal part of the math
With a win rate of 40%, the probability that the next 5 trades all lose is 0.6 to the power of 5, about 7.8%. With a win rate of 20%, the probability that the next 10 all lose is 0.8 to the power of 10, about 10.7%. Over a long record, those streaks show up sooner or later.
That is why a very low win rate demands a psychology able to sit through long runs of losses. A strategy can be coherent on paper and still impossible to run for the person executing it.
Few trades prove nothing
A backtest with 40 trades says very little. With an observed hit rate of 40%, the standard error of that percentage is the square root of (0.4 × 0.6 ÷ 40), about 7.7 points: the true hit rate could reasonably sit between 32% and 48%. With 240 trades, the same calculation gives about 3.2 points.
One way to get more trades is to test the same logic on smaller time frames, which raises statistical significance and leaves room to filter. But more trades mean more data, not more profit, and each one pays its costs. And tuning the strategy on those extra trades until the curve looks perfect is explicit overfitting.
What the metrics do not tell you
A profit factor of 1.2 sounds comfortable. If gross profit is 12,000 and gross loss is 10,000, the result before costs is 2,000. With 1,500 in commissions and spreads, it falls to 500: costs took 75% of the edge.
A backtest also depends on the data used, and another broker's data can give a different result. And no metric foresees a sudden change in market regime. That is why you look for robustness, not just a pretty number.
A beautiful curve in a backtest is not a green light for live trading either: robustness tests are still missing, and a strategy that depends on a bullish bias can fail outside it. Testing it on other assets and time frames shows how much of its result is logic and how much is context.
A martingale recovers losses with more size and pays for it with a drawdown
A martingale keeps buying or increasing size while the position is at a loss, hoping to exit when the balance turns positive. It starts from an attractive idea: under normal conditions, markets tend to recover. The risk lies in deep pullbacks, like those of past crises, because exposure grows just when the market falls. With leverage, that drop can threaten the account.
The arithmetic of the classic case, doubling size after each loss, shows it: with a starting unit, six losses in a row add up to 63 units lost (1 + 2 + 4 + 8 + 16 + 32) and the seventh trade would ask for 64. A system can have a similar exit, waiting for the balance to turn positive, without chaining trades or raising size exponentially, and that difference in risk handling is what counts. So when evaluating a robot, it pays to ask how size changes after a loss.
A three-question test for any robot
- Are the three layers defined? Entry, exit and risk management.
- Do you know the combination of win rate and reward to risk? One of the two alone is not enough to judge it.
- Were costs measured and was it tested on different data? A result that vanishes when the data changes is not reliable.
Understanding the algorithm is the best protection
Whoever understands how an algorithm is built and how it is measured is less exposed to easy promises, and to unfounded fears too. You do not need to write a line of code to start asking the right questions.
If you want to see this introduction step by step, with one example in code and another on block-based platforms, the program Cómo Funciona un Algoritmo de Trading (How a Trading Algorithm Works) develops it without requiring prior programming knowledge: Cómo Funciona un Algoritmo de Trading.
Educational content. Cronoss is not a broker, investment firm or financial adviser, and nothing above is an investment recommendation.
Frequently asked questions
What is a trading algorithm?
It is an ordered, defined sequence of rules that decides when to open a trade, when to close it and how much to risk, and that a machine runs the same way every time.
Do you need to code to create a trading algorithm?
Not necessarily. Block-based platforms and artificial intelligence tools can generate the code. The hard part is defining sensible market logic and measuring whether it works.
What is profit factor?
It is gross profit divided by gross loss for a strategy. A value of 1 is the theoretical break-even before commissions, and above 1 the strategy earned more than it lost in the tested record.
Why can a low win rate be uncomfortable?
Because it produces long losing streaks even when the strategy is coherent. With a 20% win rate, the chance that the next 10 trades all lose is about 10.7%.
How many trades does a backtest need to be reliable?
There is no single number, but with few trades the margin of error is wide: with an observed 40% hit rate, 40 trades leave about 7.7 points of standard error and 240 trades about 3.2.
What is the risk of a martingale?
It raises size or keeps buying while the position loses, so exposure grows just when the market falls. With leverage, a deep drawdown can threaten the account.