Key takeaways
- An approach with no rules cannot be measured, and what is not measured cannot be corrected or improved.
- A system answers three questions: when to enter, when to exit and how much to risk.
- Trading costs trim a strategy edge: a backtest that ignores them overstates it.
- Overfitting makes a system know only the past; it is fought by validating on data not used to build it.
- People and algorithms split the tasks: context analysis is human, consistent execution belongs to the machine.
- A strategy that becomes popular gets squeezed: when many people trade the same rules, the edge flattens.
Almost everyone starts trading the same way: with a hunch, a chart and the feeling that this time it looks obvious. Some people learn that way and others do not, but almost nobody can explain afterward why it worked or why it failed.
The underlying problem is not intelligence or effort. It is that an approach with no rules cannot be measured, and what is not measured cannot be corrected.
Trading systematically does not remove error: it removes improvisation, and that is what lets you find out which errors you are making.
Stage 1: the discretionary trader decides by intuition
At this stage decisions come from intuition and the mood of the day. The trader enters with few rules or none, manages risk poorly and needs to sit in front of the screen almost all the time so as not to miss opportunities.
Daniel Kahneman described two modes of thinking: one fast and intuitive, the other slow and logical. Trading demands extreme discipline, and the brain sometimes uses the mode that does not fit the situation. A messy discretionary approach also cannot be tested: if the rules are unclear, there is no way to know whether the method works or whether there was just luck.
Stage 2: the technical trader looks for rules and falls into the holy grail trap
The second step is to look for structure. The person starts with indicators, supports, resistances and patterns, and sees the market more methodically. It is a real improvement over trading on impulse.
The risk lies in the search for the perfect combination of indicators. That search can take weeks, months or years, because every combination looks good in some stretch of the past. Some traders are profitable at this stage, but they usually stay glued to the chart waiting for signals, with uneven risk management and strategies that are hard to test rigorously.
Stage 3: the mechanical trader writes rules that can be tested
Here trading starts to look like a profession. The rules are precise and answer three questions: when to enter, when to exit and how much to risk. Since everything is defined, it can be turned into code and backtested, meaning tested on historical data.
That exercise yields metrics (KPIs) for the strategy and allows errors to be corrected with evidence. The mechanical trader receives signals from a robot but executes them by hand, so there is no longer a need to watch the chart all day.
Measurable rules, and why a famous strategy wears out
What sets a mechanical system apart is that every rule can be written down, coded and tested. Price-channel rules, like those taught to the so-called turtle traders, are a classic example of that approach. But the test brings an uncomfortable lesson: a strategy that becomes popular gets squeezed.
When many people trade the same rules, the edge flattens, and the versions floating around the internet usually end up near break-even. Improving them takes analysis of which filters help, and even then it pays to distrust those used only because "they say it works". That is why a strategy gets retested on current data before it is trusted, however famous it is.
Stage 4: the automated trader moves from executor to researcher
In the last stage execution also goes to an algorithm. That allows trading several markets at once and diversifying without the monitoring load growing. The job changes: it is no longer about pressing buttons, but about researching new strategies, improving existing ones and retiring those that stopped working.
Emotions do not disappear, they move. Instead of attaching to each trade, they attach to a different question: does the strategy stay inside the ranges the tests showed? If it drifts out, there is something concrete to review, or the option to switch it off.
What each one does better
An algorithm feels no fear, does not tire, does not confirm its own beliefs and always executes with the position size it was given. Cognitive biases do not affect it, and it can follow many assets and time frames at once. On consistency, speed, risk execution and scale, the edge is its.
On market analysis, however, people still have a role: interpreting context, deciding which strategies deserve research and noticing when the environment has changed. The way forward is not to choose between person and machine, but to split the tasks according to who does them better.
Backtesting measures an edge, and costs trim it
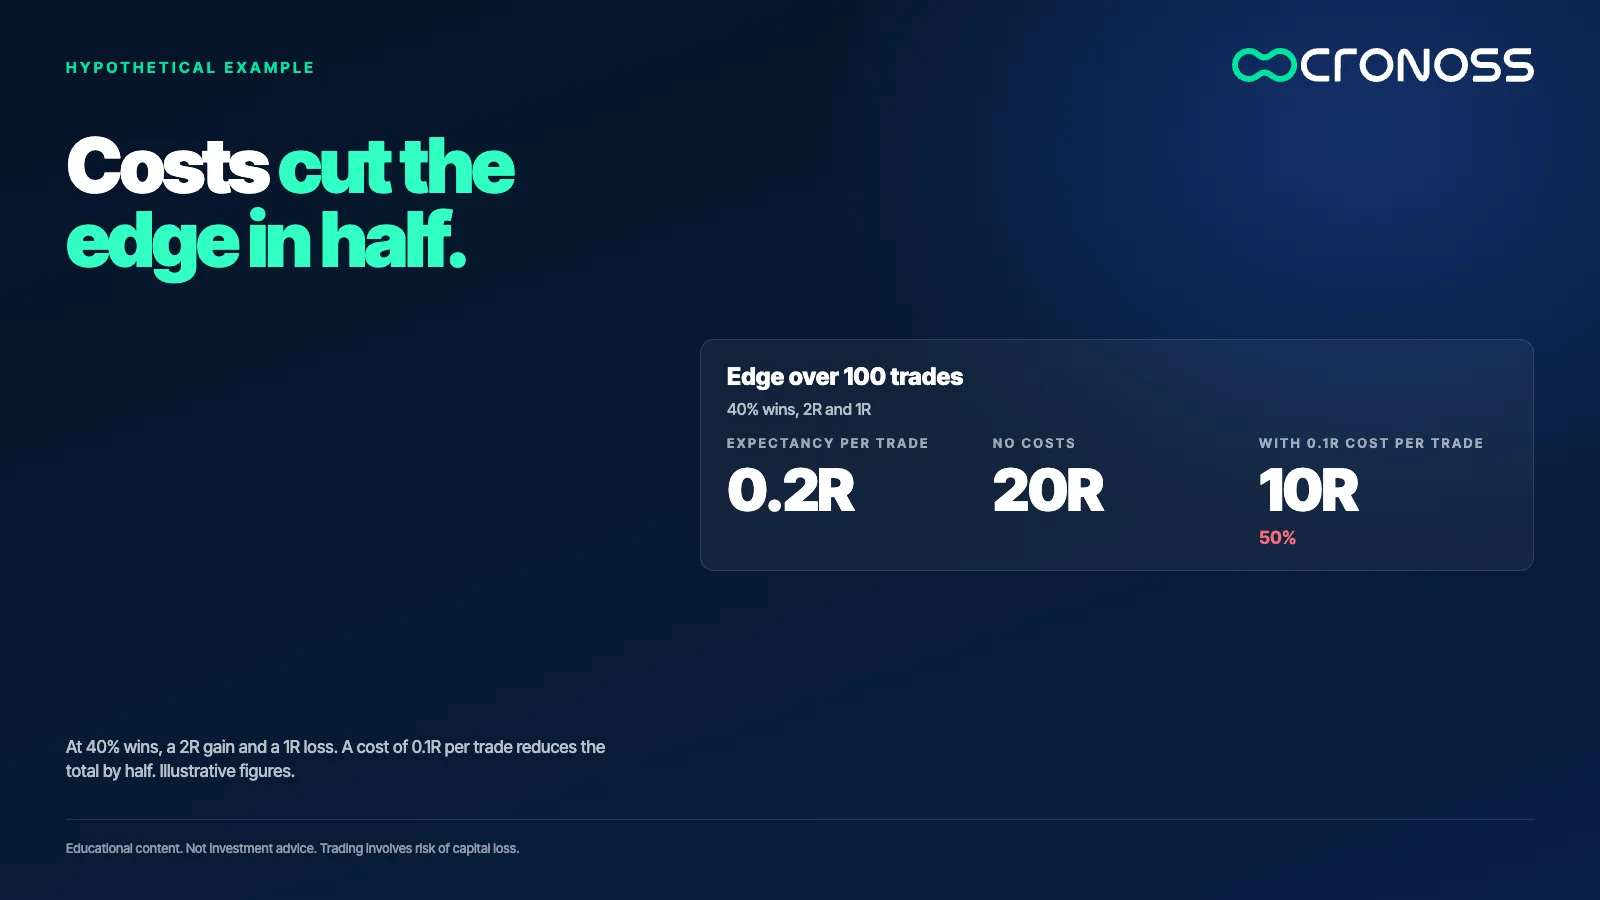
Picture a strategy with made-up numbers: it wins 40% of its trades and the other 60% lose. Each winner returns 2R and each loser costs 1R, where R is the amount risked per trade. The expectancy per trade is 0.4 × 2 minus 0.6 × 1, which is 0.2R. Over 100 trades that is 20R.
Now add a cost of 0.1R per trade for spread and commissions. Expectancy drops to 0.1R and the total to 10R. Half the edge vanished through costs. A backtest that ignores this shows a strategy more attractive than the real one.
Overfitting: a system that only knows the past
Overfitting happens when an algorithm fits historical data too well and learns the noise, not the rule. Test hundreds of parameter combinations and one will look excellent by pure chance. The defense is to validate on data that was not used to build the system.
The other drawbacks are real too. They demand broad knowledge (programming, statistics, risk management, economics) and the process works like a series circuit: a mistake in any link compromises the whole result. The hardest work comes before trading.
A three-question test
- Can you write on one page when you enter, when you exit and how much you risk? If it does not fit, it is still intuition.
- Can you count a hundred historical cases with those rules? If not, there is no evidence.
- Which data did you not use to build them? If the answer is "none", the result is probably overfitted.
A system is a way to learn
Moving from discretionary to systematic guarantees no results. It guarantees that every result has an explanation you can review. That is the most lasting advantage: learning from data, not from memory.
If you want to build those foundations from scratch, with units of measure, orders, backtesting and system types, the program Fundamentos del Trading Sistemático (Foundations of Systematic Trading) covers them in order: Fundamentos del Trading Sistemático.
Educational content. Cronoss is not a broker, investment firm or financial adviser, and nothing above is an investment recommendation.
Frequently asked questions
What is systematic trading?
It is trading with rules written in advance that define when to enter, when to exit and how much to risk. Because the rules are fixed, they can be tested on historical data and corrected with evidence.
What is a backtest?
It is the test of a strategy on historical data before risking real capital. It reports past behavior metrics but guarantees no future results and must include trading costs.
What is overfitting in a strategy?
It is when a strategy fits historical data too closely and learns noise instead of a useful rule. It is reduced by validating on data that was not used to design it.
Do you need to code to trade systematically?
Not for the first stages: you can start by writing clear rules and testing them by hand. Coding makes backtesting and automation easier, but it comes later.
Why does a famous strategy stop working?
Because when many people trade the same rules, the edge that existed shrinks until it sits near break-even. That is why any strategy should be retested on current data before trusting it.