Key takeaways
- A three-candle gap exists when the wicks of the first and third candles do not touch, which requires a strict inequality when coding it.
- The institutional explanation of the pattern is a claim to examine; the pattern itself does not prove who moves price or that it will fill.
- In a class test with commissions, the short side destroyed the edge and the long side sat barely above zero on an index with an upward bias.
- A limit order at the previous candle's extreme works as a natural filter, but the improvement was modest.
- An indicator filter that removes almost the whole sample invalidates itself, because too few trades remain to draw conclusions.
Three consecutive candles leave a gap between the first and the third, with a big candle in the middle. For some traders that gap is the footprint of large institutions and a kind of magnet: price, they say, will come back to fill it. For others it is an inefficiency that corrects itself. For a third group it is just a way of describing a sharp move.
It has its own name, fair value gap, and circulates with a lot of confidence on social media and in courses. That is reason enough to treat it with caution. A three-candle gap is a pattern that can be defined, counted and tested; that institutions chase it is a claim to examine, not a fact.
What is a three-candle gap?
The pattern consists of three consecutive candles. The middle one is large, and it leaves empty space relative to the other two: the low of the most recent candle sits above the high of the first, or the other way around. The color of the side candles does not matter; what matters is that their wicks do not touch.
That is why the condition is written with a strict inequality. If the last candle's low is greater than the first candle's high, there is a gap. If they are equal, the wicks touch at some point and there is no gap. That precision looks like a detail, but it decides how many signals the rule produces.
The bullish gap, with a big green candle in the middle, is read as an upward overextension. The bearish one is its mirror image.
Two explanations for the same pattern
The popular explanation is institutional: a large entity injects a lot of liquidity at once, the middle candle absorbs that entry and leaves a gap that the market then "must" fill. Sometimes it is added that a secret algorithm run by those institutions hunts the liquidity of retail traders.
The explanation defended in class is more modest: after a very accelerated move, price tends to come back, and the pattern merely describes that overextension. The secret-algorithm narrative was explicitly criticized as a myth built around a pattern that has existed for decades and that many traded in a similar way.
Neither explanation is proven by the pattern itself. A story about who moves price is not proof that price will come back. What you can do is write the rule and measure what happens.

How it becomes a rule
The class rule was minimal. For the short side: detect a bullish gap, with a green middle candle whose body overlaps the range of the first, and enter at market on the next open, expecting the return. For the long side: the mirror image. The exit is by time, after two candles.
An expiry rule that follows from the hypothesis itself was added: if price does not return to the gap within the next five or ten candles, the signal loses meaning and is discarded. And the need for a catastrophic loss limit was mentioned, because a position held for two days can face a crash.
What the class test showed
It was tested on a stock index with daily data from 2012 and commissions included. The initial result was that the rule showed no clear edge. The short side destroyed any edge there might have been; the long side sat barely above zero, which is not tradable.
The instructor attributed the difference between sides to the index's upward bias: a sharp drop looks more like a discount than a change of trend. It is a plausible explanation, not one verified here.
Replacing the market entry with a limit order at the previous candle's extreme improved the curve slightly. The limit order works as a natural filter: it waits for an additional penetration before entering and avoids part of the noise. But the result was still modest. Testing on shorter candles made the behavior much worse.
The filter dilemma
A trend-strength filter, such as ADX above a threshold, removed losing trades. The problem: it removed so many that too few were left to draw conclusions. A filter that strips out almost the whole sample invalidates itself.
The instructor also pointed out an advantage and a trap of pure candle patterns. The advantage: they have no indicator periods to tune, so they are less exposed to overfitting. The trap: every indicator filter reintroduces parameters that would have to be optimized. His conclusion was that, quantified, the pattern is not as profitable as it is said to be, and he left it as an exploration assignment for the next class.
The ways it can fail
- Narrative without proof. Believing the gap must fill because an institution left it.
- Insufficient sample. Every added filter shrinks the signals.
- One side only. Long and short behave differently on an index with an upward bias, and pooling them hides which one contributes.
- Timeframe. On shorter candles the behavior got worse.
- Costs. With commissions included, a minimal edge disappears.
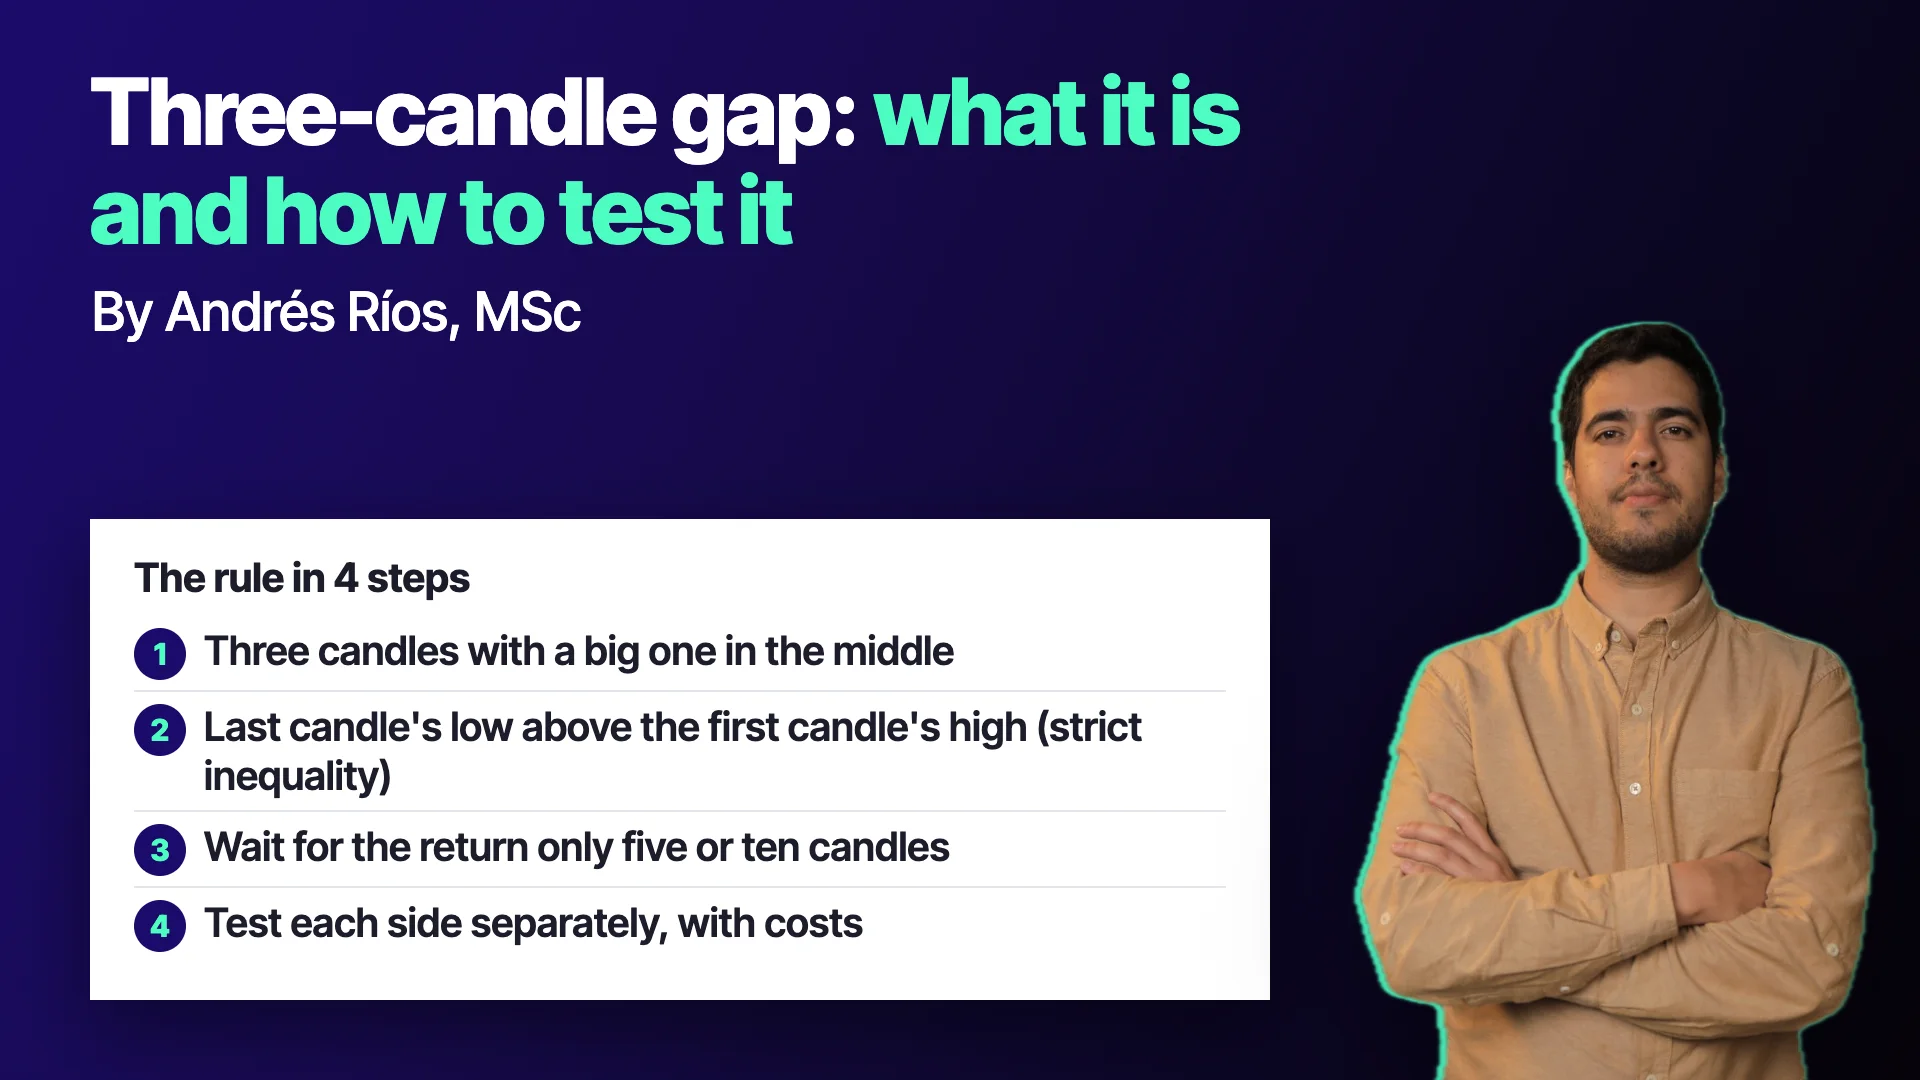
A four-step test
- Write the gap with strict inequalities. And decide once how large the middle candle must be.
- Define the signal's lifetime. How many candles you wait for the return before discarding it.
- Test each side separately, with costs. And compare against not trading the pattern.
- Treat the explanation as a hypothesis. If you say "institutions chase it", ask what data would prove it.
The gap does not know who left it
The usefulness of this pattern is didactic. It forces you to separate three things that tend to get mixed up: a precise definition of what you see, a story about why it happens and a test of whether it works. Only the third one decides.
When an explanation sounds too sure, that is the moment to ask it for proof.
To go deeper into how price is read and how institutional-reading ideas are put to the test, the program Lectura Institucional del Precio (Sistema M1-OS) (Institutional Price Reading, M1-OS System) works through them rigorously: see the program.
Educational content. Cronoss is not a broker, investment firm or financial adviser, and nothing above is an investment recommendation.
Frequently asked questions
What is a fair value gap?
It is a gap across three consecutive candles: the middle candle is large and leaves a space between the first candle's high and the third candle's low, or the reverse. It is defined only with prices, regardless of the side candles' color.
Do institutions chase the fair value gap?
It is a popular claim that the pattern itself does not prove. A more modest explanation is that after a very accelerated move price tends to come back, and that too must be tested with data.
Is the fair value gap profitable?
In a class test on a stock index, with daily data and commissions, the short side had no edge and the long side sat barely above zero. The instructor concluded that, quantified, it is not as profitable as it is said to be.
How long should I wait for price to fill the gap?
Class proposed discarding the signal if price does not return within five or ten candles, since past that window the pattern loses predictive power. That expiry rule must also be tested.


