Key takeaways
- An all-time high describes the price, not the risk, so on its own it does not show that a bubble exists or that one does not.
- When a few companies carry a large weight in an index, their poor results can drag the whole index down even if the rest hold steady.
- The price-to-earnings ratio shows how many times the price equals one year of earnings, and comparing it with history gives context.
- If the price rises much faster than earnings, the market pays more for each unit earned, and that deserves a closer review.
- A fast recovery does not guarantee a fair valuation, and the real risk depends on when you need the money.
Every time a stock index reaches an all-time high, two opposite headlines appear: one celebrates the strength of the market and the other warns of a bubble. Both can sound convincing, and the problem is that neither one, by itself, tells you how much risk you personally carry.
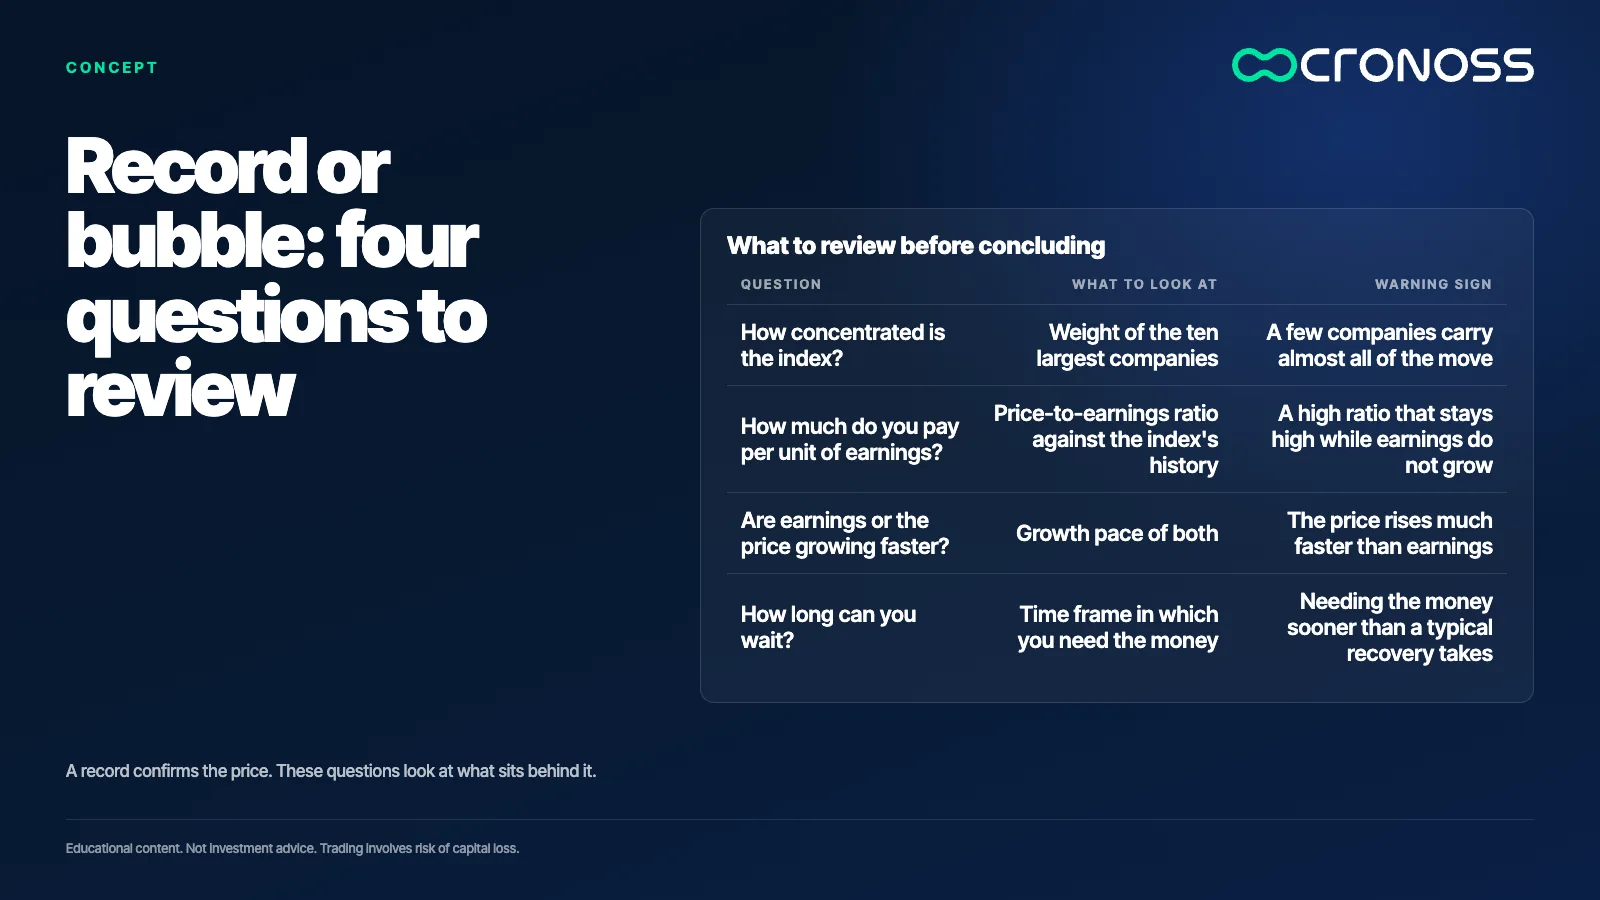
The useful question is different: what separates a record backed by real earnings from a price that has moved away from what companies produce? That difference can be observed with four simple tools: the concentration of the index, the relationship between price and earnings, the pace at which both grow, and the way the market recovered from earlier falls.
An all-time high describes the price, not the risk. To know whether there is a bubble, you have to look at what sits behind the price.
A record only tells you about the price
An all-time high means the index is above every previous level. That confirms the price went up, but it does not say whether it rose because companies earn more or because investors are willing to pay more for each unit of earnings. A record can appear in both scenarios, and on the surface they look the same. That is why the record is the starting point of the question, not the answer. The same record can appear early in a healthy expansion or late in a period of euphoria, and the number looks identical in both cases. Anyone who uses the record as the argument to buy or to sell is relying on a number that does not tell the two cases apart.
Concentration: when a few companies weigh more than the rest
Most stock indexes weight each company by its market size. Larger companies carry more weight, and when the index rises strongly, a large part of the move often comes from a few of them. This is concentration. An index can climb a lot even when most of its companies stay flat, because the weight of the largest ones drives the result.
This matters for risk because holding many companies is not the same as being truly diversified. A broad index can, in practice, depend on a small group. If that group runs into trouble, the index feels it even when the rest keeps working. Checking the weights, not the number of names, is what reveals this.
Worked example (our own arithmetic, not a market figure): suppose ten companies make up half of the index and their prices fall 20 percent. That half contributes 0.5 x 20 = 10 points of decline to the whole index, even though the rest did not move. The weights and the fall are illustrative assumptions used to show the mechanism.
Price against earnings: the ratio that frames the discussion
The price-to-earnings ratio (P/E) divides the price of a share by the earnings it generates per share over one year. If a share costs 100 and earns 5 per share, its ratio is 20: the investor pays 20 times the annual earnings.
The ratio does not say on its own whether something is expensive or cheap. It shows how many years of current earnings you pay for with today's price. A high ratio can make sense if earnings are expected to grow a lot. A high ratio that persists without earnings growth is the signal worth watching closely. To read it, you compare it with the index's own history and with other investment alternatives, not with a fixed number that works in every case.
Price and earnings: which one is growing faster
A direct way to separate a healthy record from a bubble is to compare two paces: the growth of the price and the growth of the earnings. If both rise at a similar rate, the price-to-earnings ratio holds steady. If the price rises much faster, the market is paying more for the same unit of earnings.
Worked example (our own arithmetic): a share costs 100 and earns 5 per share, so its ratio is 100 divided by 5, which is 20. One year later, earnings rise 10 percent, to 5.5, and the price rises 50 percent, to 150. The new ratio is 150 divided by 5.5, which is about 27. The price rose more than the earnings did, and the same company now costs almost 27 times what it earns, compared with 20 before.
That change does not prove a bubble. It shows that part of the rise depends on expectations, and expectations may or may not come true.
How markets recovered after earlier falls
Many investors treat the speed of a recovery as proof of strength. A fast recovery shows that buyers were ready to come back, but it does not prove that the price is well valued. There is also no fixed rule: markets have recovered from falls over very different time frames, depending on the cause of the shock, the level of earnings and the economic context of each moment.
That is why it helps to look at the full history instead of a single episode. A fall followed by a quick recovery can be a good memory for someone who was already invested, and a bad one for someone who arrived late and bought at the top. The risk depends on how long each person can wait for the money, not on the average experience of others. Also, a recovery does not always mean earnings have caught up. Sometimes the price returns first and profits arrive later, and that gap is exactly what the price-to-earnings ratio helps you watch.
Risk: an index can take years to return to a previous high. If the money is needed within that period, a fall can become a loss for that person, even if the market eventually recovers.
What a record tells you and what it does not
A record tells you that the price reached a level never seen before. It does not tell you how much higher it can go or how far it can fall, or whether next week will be positive. It also does not tell you whether the market is expensive relative to its earnings, or whether a few companies are holding up the result.
What it can do is raise questions: how concentrated the index is, what its price-to-earnings ratio looks like against its own history, and whether earnings support the price. A record is a good moment to review those questions, because it is when emotion tends to weigh more than analysis. A common mistake is treating every record as an automatic buy or sell signal. A record is a snapshot of the price at one moment, and any decision should rest on your time frame, your ability to sit through falls and your level of concentration.
How to monitor concentration in your own exposure
- Check the weight of the ten largest positions in each fund or index you hold. The product factsheet usually publishes that list, and you can add up the weights.
- Note how much of your money depends on the same sector or the same group of companies. Include separate funds that hold the same companies, because concentration repeats there without you noticing.
- Calculate the effect of a fall: multiply the weight of the group by the assumed decline, as in the example above. Repeat the exercise every quarter or whenever your contributions change, and compare the result with the loss you could tolerate without abandoning your plan.
Price says what people pay today, earnings say how firm that payment is
An all-time high invites questions, not conclusions. The difference between a record and a bubble is not in the chart. It lies in whether earnings, concentration and the time you have to wait can hold up the price.
If you want to learn how to measure these risks calmly, review the program Fundamentos de Riesgo en las Inversiones (Fundamentals of Investment Risk).
Educational content. Cronoss is not a broker, investment firm or financial adviser, and nothing above is an investment recommendation.
Frequently asked questions
Does an all-time high mean the market is in a bubble?
No. An all-time high only confirms that the price is above its previous levels. To assess a bubble, check whether earnings, concentration and the price-to-earnings ratio support that price.
What is index concentration?
It is the weight that a few companies carry inside an index. Because many indexes weight by size, the largest companies move the result more. That is why an index with many companies can still depend on a small group.
What is the price-to-earnings ratio?
It is the price of a share divided by the earnings it generates per share over one year. It shows how many times the price equals those earnings. It is read by comparing it with the index's history and with growth expectations.
How do I check whether I depend too much on a few companies?
Review the weight of the largest positions in each fund you hold and count the companies that repeat across funds. Then calculate how much you would lose if that group fell, and compare the result with what you could tolerate.