Key takeaways
- The currency market has no central exchange, so tick volume is an estimate built from the data provider's information.
- What matters are the proportions between bars, not the absolute value of each one.
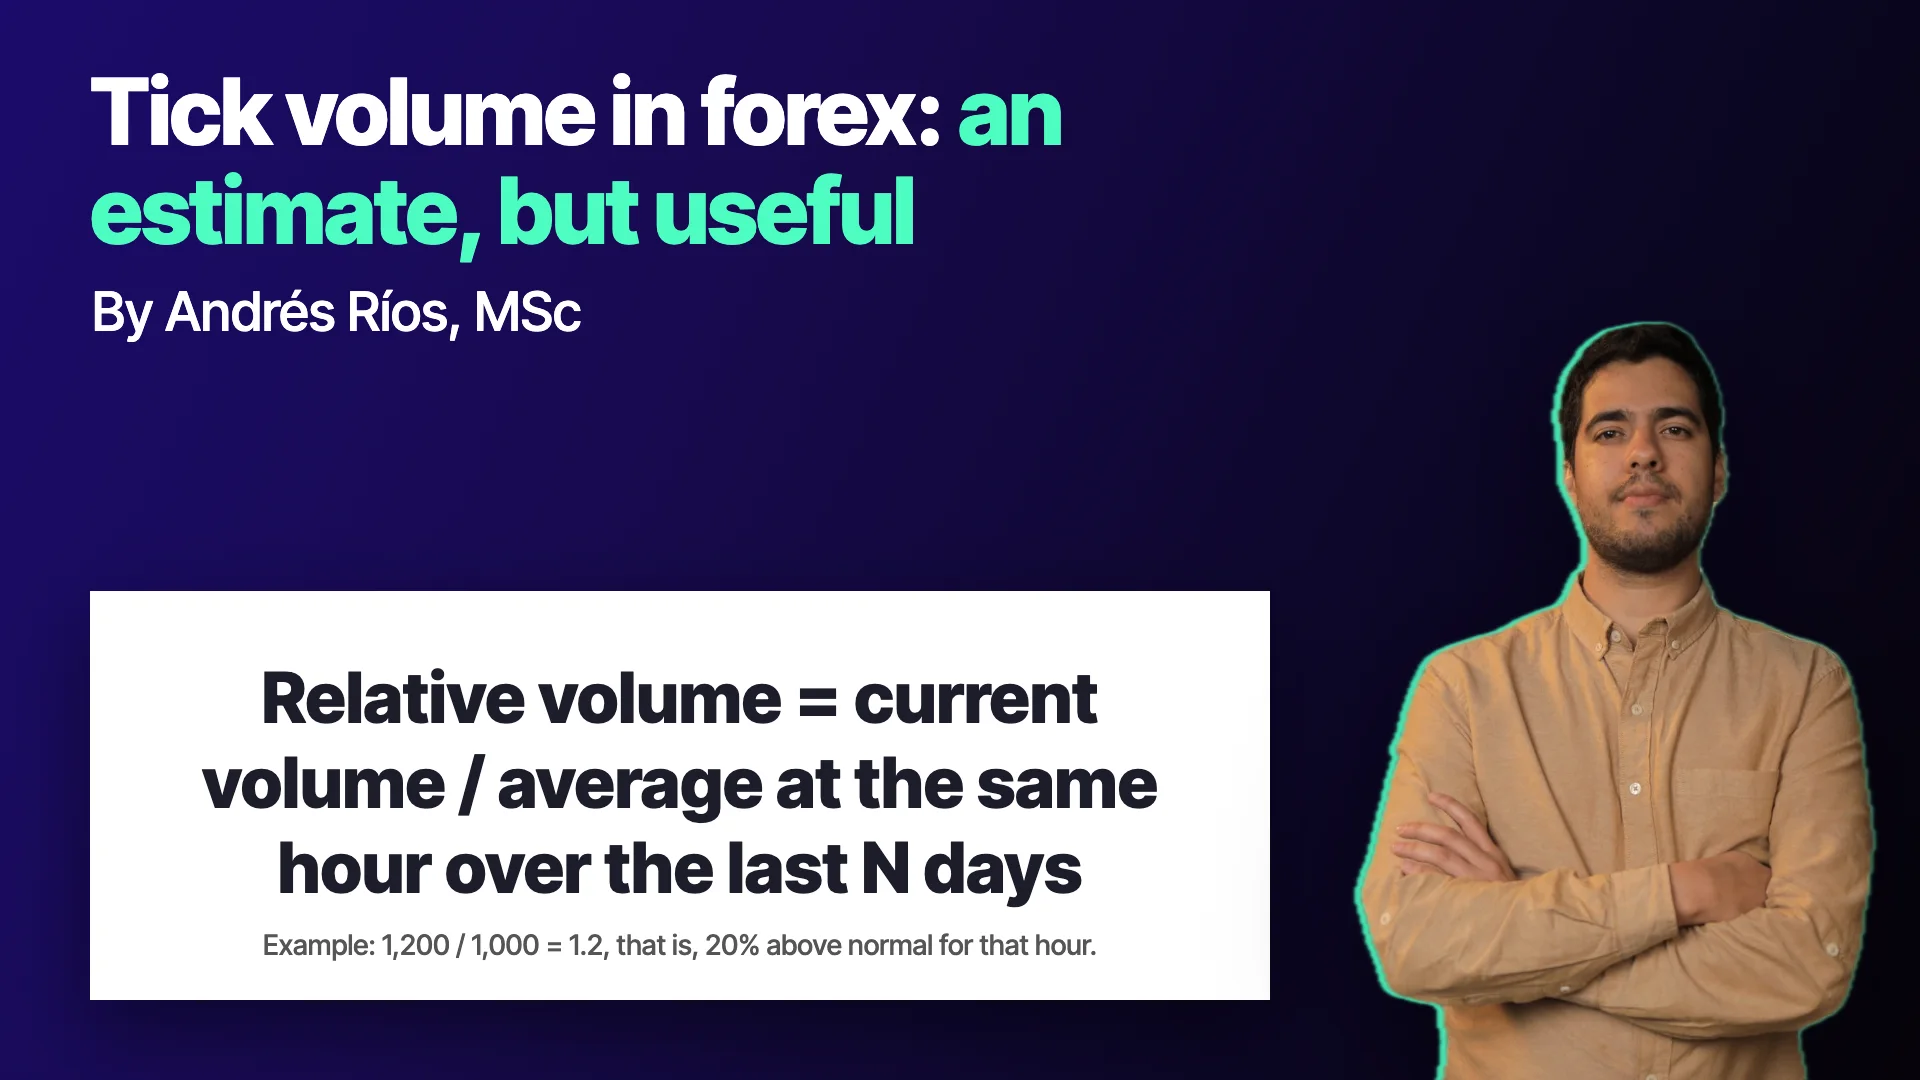
- Volume is compared with the average at the same hour on previous days, not with the immediately preceding candle.
- High or rising volume reads as commitment to the move, and low or falling volume as lack of commitment, always as a probability.
- The pair, the time of day and the averaging period change the reading, and very high volume can also mark a turn.
On stock charts, volume is a bar almost nobody argues about: it is the number of shares traded. Currency charts also have volume bars, but many traders ignore them with a familiar line: "there is no real volume in forex". The line has something true in it and a lot of misunderstanding.
The useful question is not whether that volume is exact, but what information it carries and how it is compared. Tick volume in forex is an estimate, but what matters when reading it is not its absolute value but how far it sits from normal for that time of day.
Where does forex volume come from?
In centralized markets, such as a stock or futures exchange, every transaction passes through an entity that records it. The published volume is the complete count of what was traded.
The currency market works differently: there is no single exchange. Trades happen between banks and other entities connected in a network. Each point in that network knows only part of what is going on. The volume you see on your platform is tick volume, an estimate built from the information that reaches your data provider. In class it was explained that many people think it is volume generated by the broker itself, when in reality it is estimated from liquidity and data providers.
Two practical consequences. First: the exact value of a bar can vary between providers. Second: that does not make the reading useless, as long as you do not depend on the absolute number.
What a tick actually counts
A tick is the smallest unit of price movement. According to the model explained in class, every time price moves at least one tick in any direction, that move registers the transactions that produced it. A candle's tick volume is the accumulation of those transactions during the candle's period.
The dynamic is the same as in a centralized market: more activity pushes price more. That is why, even if the figure is an estimate, its shape through the day keeps the useful information. Comparing the Nasdaq as a CFD with the Nasdaq on a real exchange, the absolute volumes differ, but the pattern through the day is very similar.
What matters are the proportions
That is the central idea: what matters is not the absolute volume as much as the changes in volume, its proportions. If two sources differ in the value of each bar but keep the proportions between bars, the information in the changes is preserved.
There is a consequence that changes how you look at the chart. Comparing a candle's volume with the immediately preceding candle gives little information, because volume varies a lot through the day for calendar reasons. What was recommended in class was to compare with the volume at the same hour on previous days.
An example with numbers
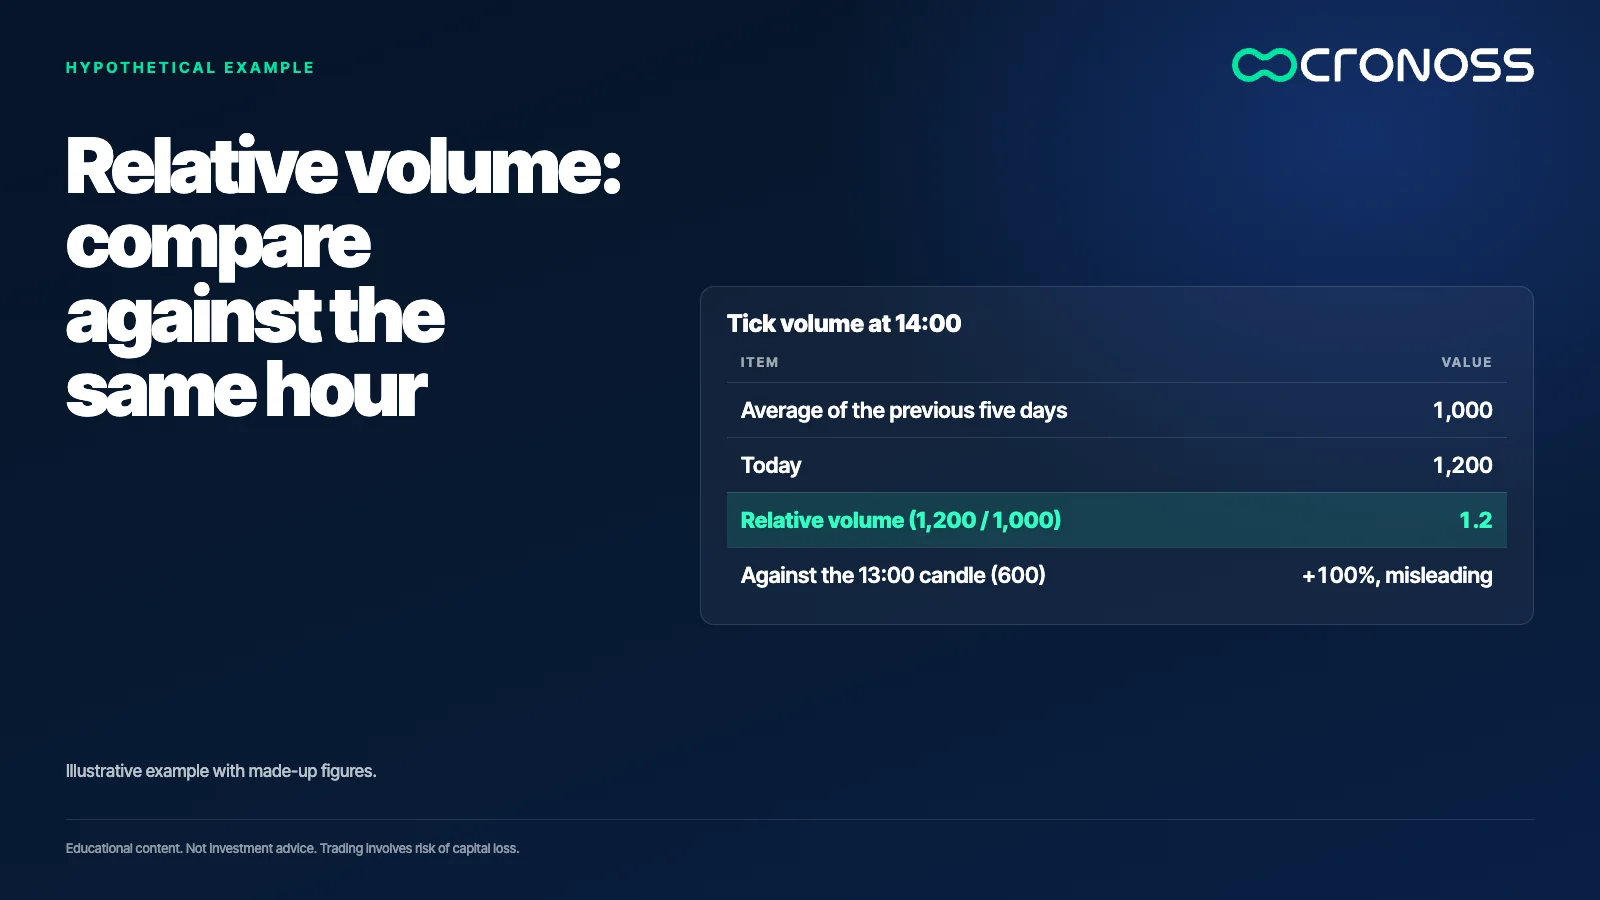
This is an illustrative example with made-up figures. Suppose that at 14:00 the tick volume of today's candle is 1,200. At the same 14:00 on the five previous days it was 1,000, 1,100, 900, 1,000 and 1,000. The average is 1,000.
Today's volume is 1.2 times its normal for that hour, that is, 20% above. If the same 1,200 had been compared with the previous 13:00 candle, which could be 600 because it is a quiet hour, it would look like a 100% increase. Comparing against the same hour avoids that mirage.
Volume as commitment
The simplest reading the class proposed is that volume measures participants' commitment to the current move. High or rising volume indicates commitment; low or falling volume indicates a lack of commitment. The analogy was gasoline: price is the distance covered and volume is the energy spent.
Applied to a pullback inside a trend: if price pulls back on falling volume, the move has little backing and is more likely just a pause that continues the prior trend. If it pulls back on rising volume, there is more commitment to the new direction and it is more likely to become a reversal.
The class was explicit on one point: this is a game of probabilities, not certainty. Very high volume can also mark a turn, and the interpretation changes with context.
What complicates it in currencies
Currency pairs pit two economies against each other, a base and a quote, and volume patterns get distorted depending on which each one is and which region of the world they are in. There is also a daily pattern of several volume peaks, tied to each region's sessions, that you need to know so as not to mistake it for a signal.
That is why the comparison against the same hour on previous days must take into account the pair, the time of day and the averaging period. Changing any of the three changes the reading.
A three-step test
- Compute relative volume. Divide current volume by the average at the same hour over recent days, instead of comparing with the previous candle.
- Write the hypothesis before looking. For example, a pullback with relative volume below 1 means a pause; with relative volume above 1, a possible reversal.
- Measure the hit rate with costs and in another period. If the reading does not improve your result compared with using price alone, it adds nothing.
An estimate is still information
Discarding volume in forex because it is not exact is throwing away half the picture. Using it as if it were an absolute figure is the opposite mistake. The middle ground is to treat it as a second data source, independent of price, read by proportions and subjected to the same testing discipline as any other.
Volume does not tell you what price will do: it tells you how many people are pushing the move you already see.
To learn to read and test volume indicators, the program Análisis Técnico Especializado en Indicadores (Specialized Technical Analysis of Indicators) works through them in detail: see the program.
Educational content. Cronoss is not a broker, investment firm or financial adviser, and nothing above is an investment recommendation.
Frequently asked questions
Why is forex volume an estimate?
Because the currency market does not pass through a central exchange that records every trade. Each point in the network knows only part of what happens, so tick volume is estimated from the provider's data.
Is tick volume useful if it is not exact?
Yes, if you read it by proportions and not by absolute value. Comparing against the average at the same hour on previous days keeps the useful information even if each bar's number varies between providers.
What does a relative volume of 1.2 mean?
That current volume is 1.2 times the average for that same hour on previous days, that is, 20% above normal. It reads as more commitment to the move, not as a signal on its own.
Does high volume always confirm the move?
No. Class made clear it is a game of probabilities and that very high volume can also mark a turn. The reading changes with context, the pair and the time of day.


