
Key takeaways
- Dow theory is Charles Dow's set of premises explaining how a trend begins, is confirmed and ends.
- It remains relevant because it offers a verifiable criterion for distinguishing a pause from the end of a trend.
- A trend goes through three phases: accumulation, participation and distribution.
- A trend is confirmed when volume and other market sectors accompany the price movement.
- A trend change is confirmed when price forms a lower high and breaks the last relevant low.
Two identical drops on a chart can signal opposite things.
One of them is a pause within the trend. The other marks its end, and at the moment they happen, they look the same.
Dow theory is the set of premises that Charles Dow formulated to explain how prices move. It describes how a trend, meaning the general direction of price over a period, begins, how it is confirmed and when it ends.
Dow theory remains relevant because it offers a verifiable criterion for distinguishing a pause from an end. That criterion is the basis of technical analysis, the reading of the market through price and its charts.
What does Dow theory say?
Dow theory holds that price leaves an orderly trail and that this trail can be read. Its premises come down to four:
- Price reflects the available information: news, data, expectations and emotions.
- The market moves in trends that pass through three phases: accumulation, participation and distribution.
- A trend is confirmed when volume and other market sectors support it.
- A trend remains valid until price shows clear signs of change.
The four premises work as a system. Each one answers a different question: what to watch, what stage the move is in, how much support it has and when it runs out.
The following sections go through each premise separately.
Why is it said that price discounts everything?
Price discounts everything because each trade records the decision of someone who acted with the information they had. A news item, an economic data point or a change in mood reaches the chart through buying and selling.
The mechanism resembles a scale. When buy orders outweigh sell orders, price rises. When supply outweighs demand, it falls.
This premise explains why Dow starts from price. Fundamental analysis studies economic and financial data, and sentiment analysis studies the mood of participants. In price, both readings have already been translated into concrete decisions.
The premise has a limit worth clarifying. It asserts that price contains the decisions already made, and tomorrow's decisions are not yet on the chart.
That is why other approaches keep their usefulness. They help to understand what information could reach price later.
What are the phases of a trend according to Dow?
According to Dow, a trend goes through three phases: accumulation, participation and distribution. Each phase is recognized by three things: what price does, the volume that accompanies it and the signal that marks the move to the next phase.
Accumulation occurs after a decline or a period without direction. Few participants buy, the market pays little attention and price oscillates within a narrow range. Accumulation ends when price leaves the range with more volume than usual.
Participation is the most visible phase. More buyers join, momentum builds and price forms higher highs and higher lows. This phase ends when each new high costs more effort and advances less.
Distribution arrives when the move begins to show fatigue. Those who bought in the earlier phases sell, and that supply slows the advance even though price stays near its highs. New highs, if they appear, are reached with less volume.
Distribution ends when price breaks the structure that supported the trend. At that point, a trend in the opposite direction becomes possible.
One warning avoids the most common confusion about the phases. Phases are clear when looking back; in real time, each transition works as a hypothesis that price confirms or rejects. The same sequence can appear on a daily chart or on a weekly one.
How is a trend confirmed?
A trend is confirmed when volume and other market sectors accompany the price movement. Without that support, the trend stays under observation.
Volume, the number of trades carried out in a period, measures how many participants back a move. A rise on high volume indicates that many buyers were willing to pay rising prices. A rise on low volume depends on a few participants and can prove fragile.
Coherence across sectors applies the same logic at the scale of the market. If related assets rise at the same time, demand is broad. If a single asset rises while its environment falls or stalls, the move rests on a narrow base.
Confirmation measures the breadth of support behind a move, in addition to its direction. A price that rises without volume or sector support is still a rise, although with less evidence of continuity.
When does a trend end according to Dow?
For Dow, a trend ends when price breaks important levels and shows clear signs of change. An isolated correction, that is, a temporary pullback against the main direction, stays below that threshold.
Duration helps separate both cases. Primary trends can last months or years, secondary trends weeks and minor trends days or hours. A pullback of a few weeks within a primary trend usually corresponds to a secondary move.
The clearest signal comes from structure. In an uptrend, each high exceeds the previous one and each low stays above the one before it.
The change is confirmed when that sequence breaks. Price forms a lower high than the previous one and then breaks the last relevant low. That break shows that buyers stopped defending the levels that had held the market up.
A practice follows from this premise: wait for confirmation before declaring a turn.
How does Dow theory look on a chart?
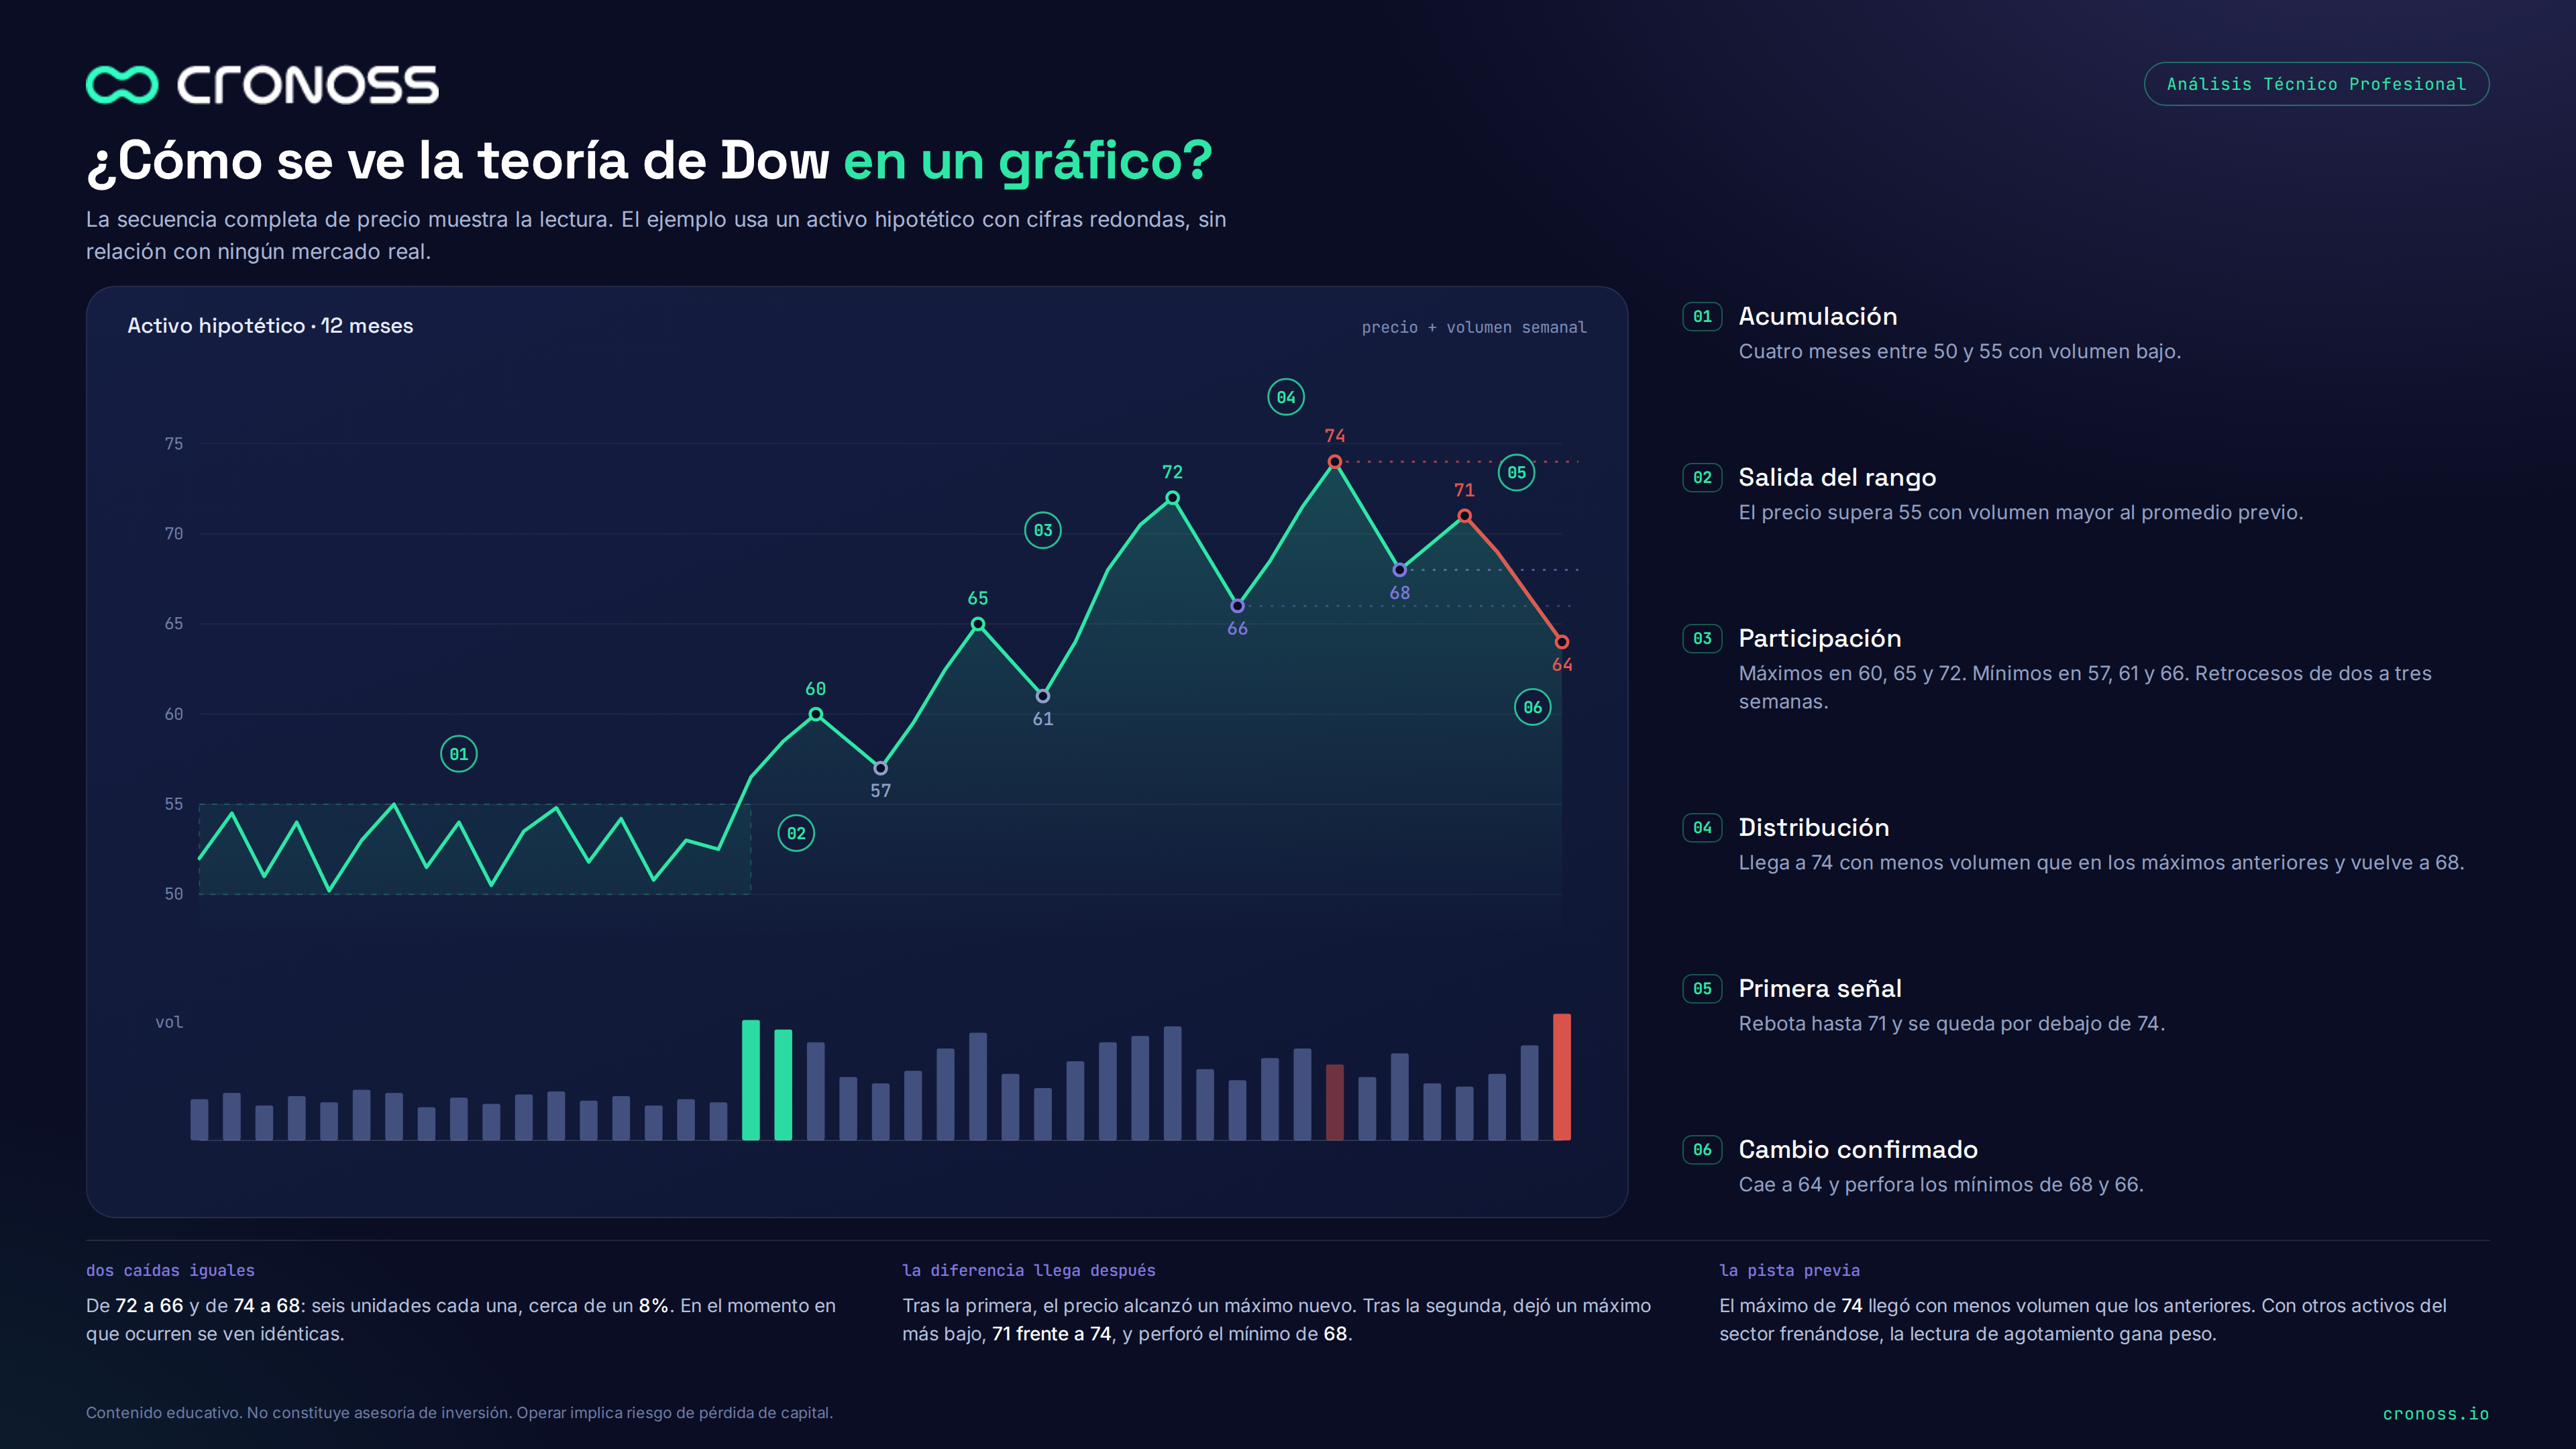
Dow theory is best seen in a complete price sequence. The following example uses a hypothetical asset with round figures, unrelated to any real market.
- Accumulation. For four months, price oscillates between 50 and 55 on low volume.
- Range breakout. Price exceeds 55 on volume greater than the average of the prior months.
- Participation. Over the following five months, price marks highs at 60, 65 and 72, with lows at 57, 61 and 66. Each pullback lasts between two and three weeks.
- Distribution. Price reaches 74 on less volume than the previous highs and pulls back to 68.
- First signal. Price rebounds to 71 and fails to exceed 74.
- Change confirmed. Price falls to 64, below the lows of 68 and 66.
The drops from 72 to 66 and from 74 to 68 each measure six units, close to 8%. When they occur, the two drops look the same; what distinguishes them appears later.
After the first drop, price continued toward a new high. After the second, it formed a lower high, 71 versus 74, and then broke the low at 68.
Volume offered an earlier clue, because the high at 74 came with less backing than the previous ones. If, in addition, other assets in the same sector had stopped rising, the exhaustion reading would gain weight.
What mistakes are common when applying Dow theory?
The two most frequent mistakes are declaring the end of a trend on the first drop and reading price without its confirmation.
The first mistake confuses a correction with a change. Whoever makes it reacts to a drop such as the one from 72 to 66 in the example and abandons the bullish reading while the structure remains intact. A drop is assessed by what it leaves in the structure: a higher low preserves the trend.
The second mistake ignores the third premise. A rise on declining volume and without support from its sector receives the same reading as a backed rise. Thus two moves with very different evidence end up read with the same confidence.
Both mistakes share the same origin: they treat an isolated data point as a conclusion. Dow proposes reading the full sequence.
What can you check on your own?
You can test Dow's premises on any daily chart with the volume indicator enabled. The check has three steps:
- Mark the last four visible highs and lows and classify the structure as rising, falling or flat.
- Compare the volume of the stretches moving in the trend's direction with the volume of the pullbacks.
- Check whether the last pullback broke the previous low or left a higher one.
The confirmation premise makes a claim you can test. In a supported trend, the stretches in its favor should show more volume than the pullbacks. If your chart shows the opposite, record that difference as a sign of weakness and track how it evolves.
Is Dow theory still relevant?
Dow theory remains relevant as a framework for organizing how a chart is read. Its central contribution is a criterion with verifiable conditions for deciding when a trend has ended.
That criterion has a cost worth accepting. Confirmation arrives after the turn, so the reading always lags a few steps behind the high or the low. Dow gives up detecting the exact turning point in exchange for a reading grounded in evidence.
Whoever accepts that cost gains a consistent way to separate a pause from an end.
The class Teoría Dow (Dow Theory), from Cronoss's program Fundamentos de Análisis Técnico (Technical Analysis Fundamentals), develops these premises step by step. Explore the program Fundamentos de Análisis Técnico.
Frequently asked questions
What is Dow theory?
It is the set of premises Charles Dow formulated to explain how prices move. It describes how a trend begins, how it is confirmed and when it ends, and it is the basis of technical analysis.
What are the phases of a trend according to Dow?
Accumulation, participation and distribution. In accumulation, few buy and price moves within a narrow range. In participation, more buyers join and price forms higher highs and higher lows. In distribution, the advance slows and new highs arrive on less volume.
How do I tell a correction from a trend change?
By what the decline leaves in the structure. If the pullback leaves a higher low, the trend holds. The change is confirmed when price forms a lower high than the previous one and then breaks the last relevant low.
Is Dow theory still relevant?
Yes, as a framework for organizing how a chart is read. Its cost is that confirmation arrives after the turn, so it gives up detecting the exact point in exchange for a reading grounded in evidence.