Key takeaways
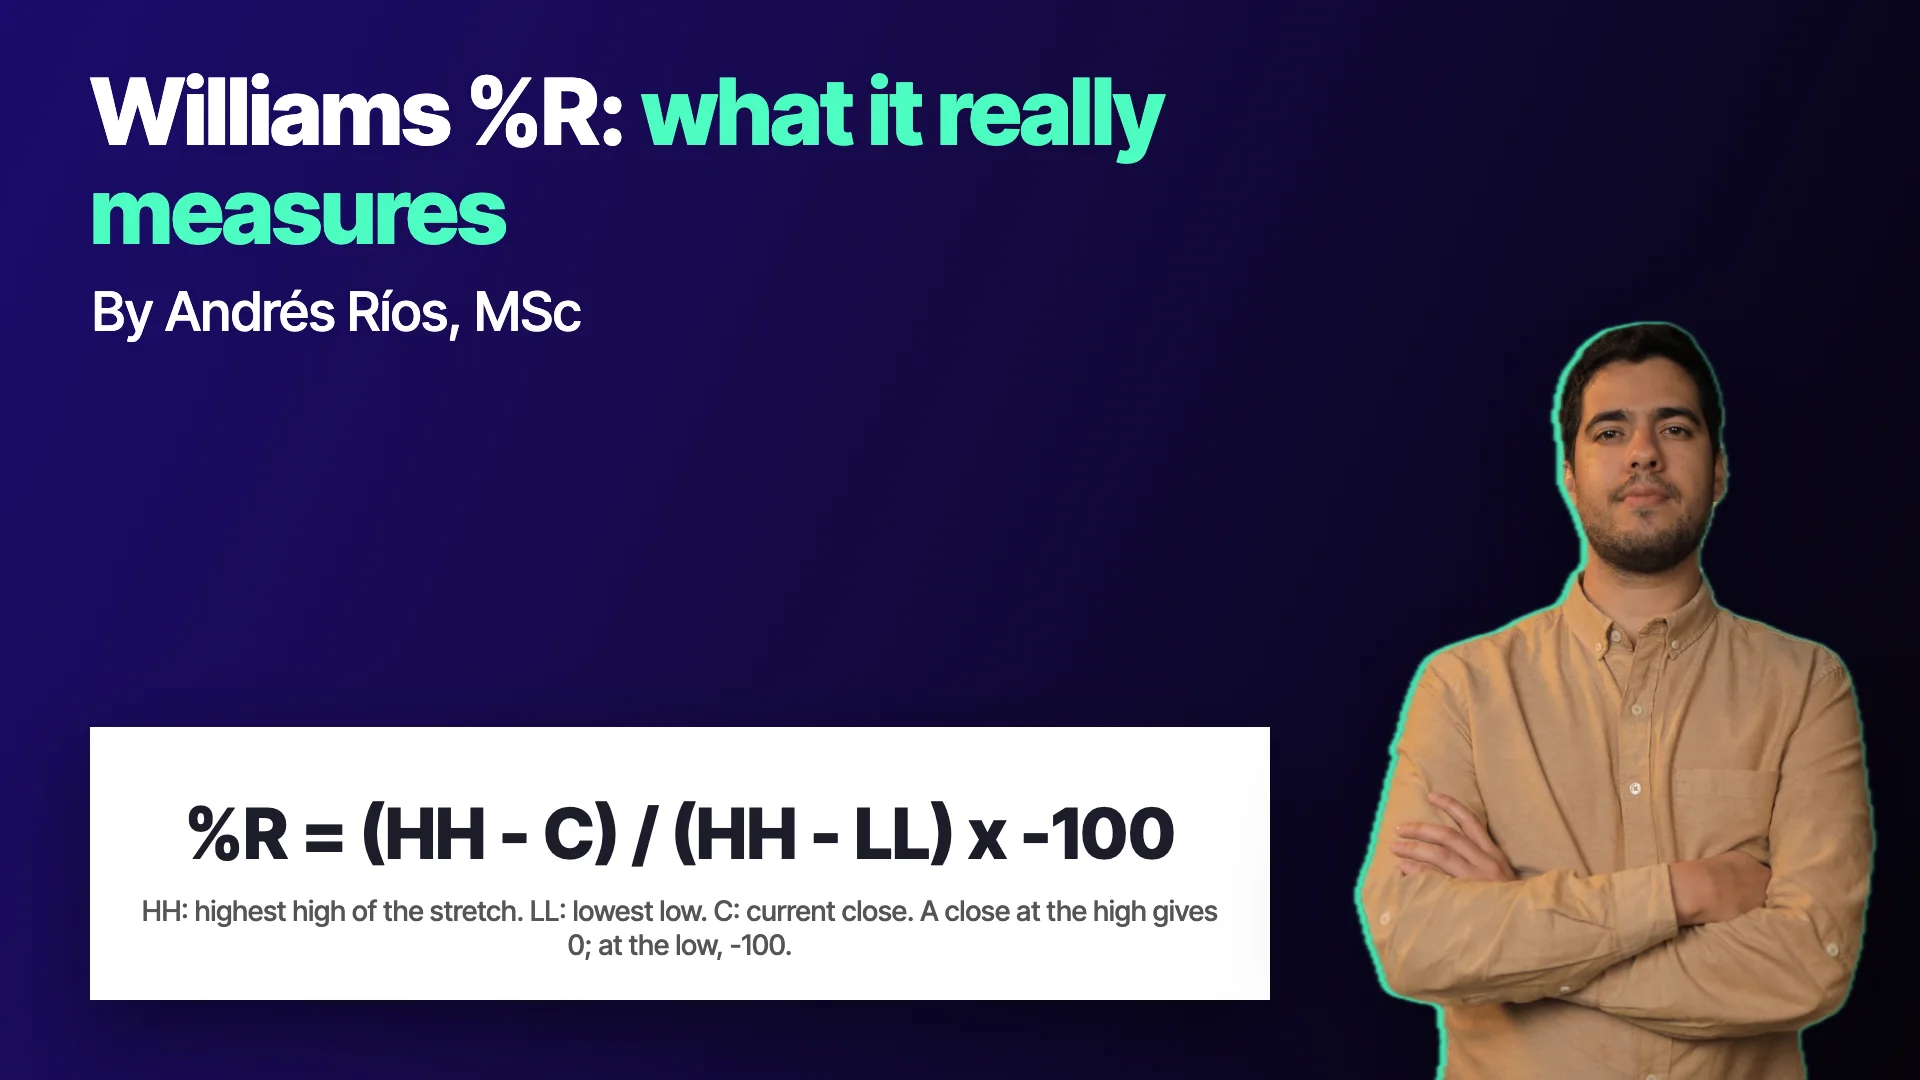
- The Williams %R compares the close with the high and low of a recent stretch and returns a value between 0 and -100.
- The %R equals the stochastic: the basic stochastic is 100 plus the %R, so there is no hidden edge in choosing one.
- An extreme reading can also describe a strong trend, so it does not equal a change of direction.
- In a class test with commissions, a rule adapted from the indicator had a drawdown two to three times its annual return.
- Every variant tested on the same history raises the chance that one works by coincidence.
The Williams %R is an indicator that gives readings between 0 and -100, always negative, and that many charts show as a line moving between two bands. Anyone seeing it for the first time tends to ask two things: what exactly is it calculating, and does an extreme reading mean price is about to change direction?
The first question is answered with a formula of three numbers. The second, with a test. The %R does not measure whether the market is expensive or cheap: it measures where in the recent range price closed, and that information alone does not say what comes next.
What does the Williams %R calculate?
The indicator takes a number of periods, say 14, and looks for two extremes in that stretch: the highest high and the lowest low. Those two values define the range price has covered. It then measures how far the current close sits from the highest high, as a proportion of that range.
The formula is: %R = (highest high - close) / (highest high - lowest low) x -100.
A close right at the stretch's high gives 0. A close right at the low gives -100. Everything else falls in between. The negative sign comes from the formula's shape: the distance to the high is multiplied by -100, and the resulting scale lands on the negative side. In class, people speculated it was chosen for visual clarity; what matters is that it does not change what it measures.
An example with numbers
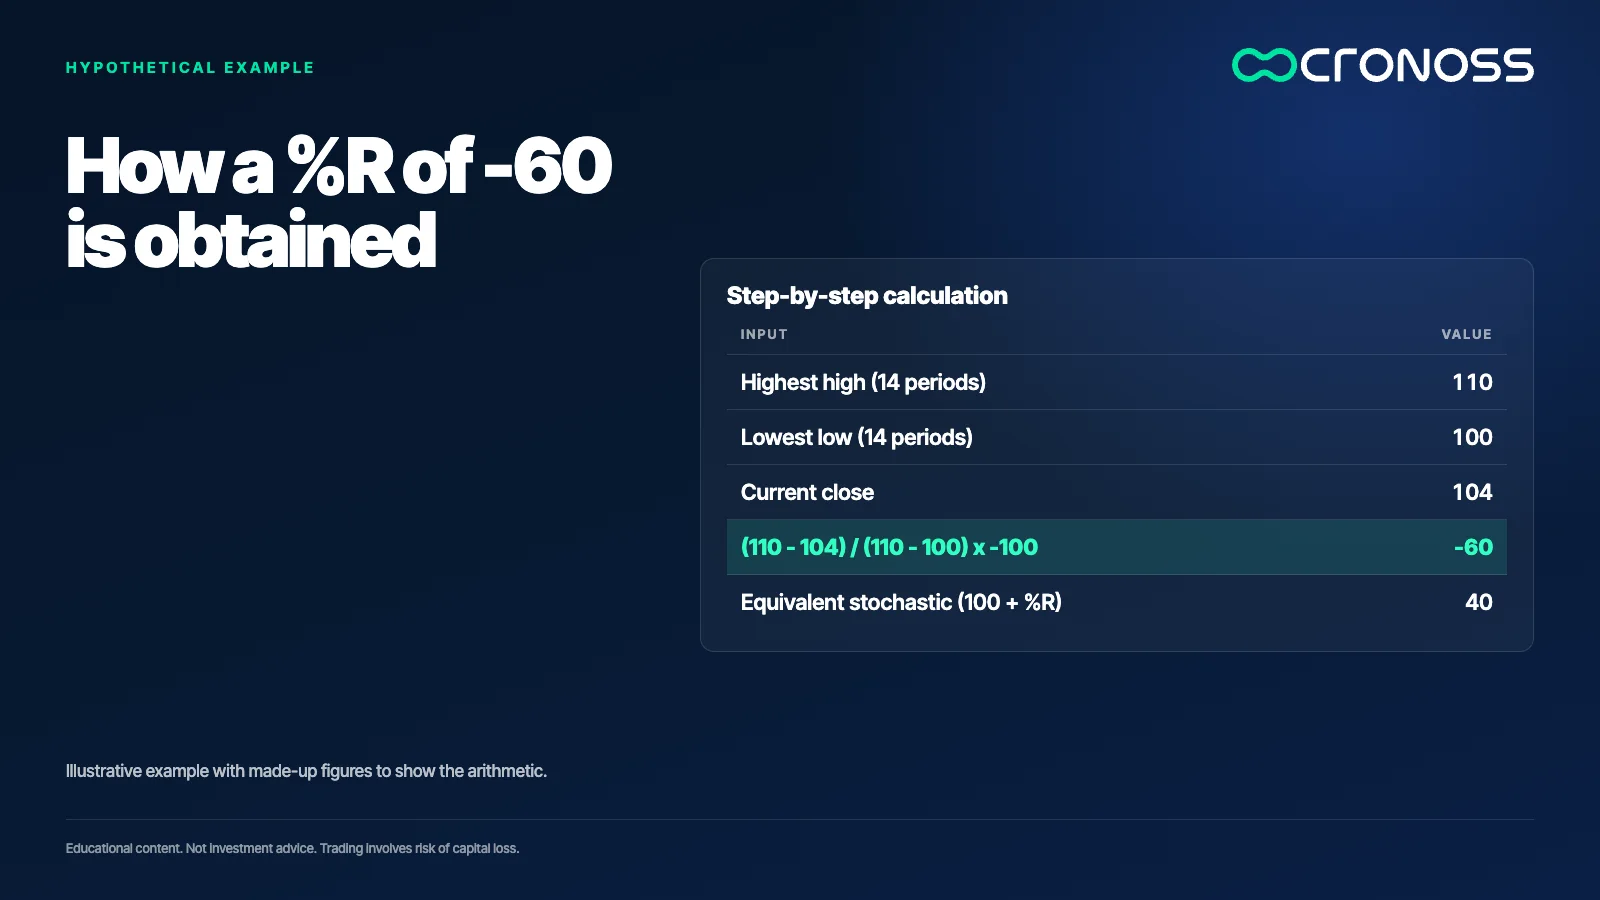
This is an illustrative example, with made-up figures to show the arithmetic. Suppose that over the last 14 periods the highest high was 110 and the lowest low was 100, and the current close is 104.
The numerator is 110 - 104 = 6. The denominator is 110 - 100 = 10. The ratio is 0.6, and multiplied by -100 it gives a %R of -60. In words: the close is 60% of the range below the high, that is, in the lower 40% of that stretch.
If tomorrow the close rises to 109, the %R becomes -10. If it falls to 101, it becomes -90. With those three calculations you have the whole indicator.
It is the same indicator as the stochastic, flipped
One of the most useful observations in class was that the Williams %R and the stochastic oscillator measure practically the same thing. The stochastic in its basic form is written as (close - lowest low) / (highest high - lowest low) x 100, and the result equals 100 plus the %R value.
In the example above, the stochastic would give 40 and the %R would give -60. Two different scales for the same information. The stochastic is also usually used with smoothed lines, a fast one and a slow one, and their crossovers are part of the usual signals; the %R is usually read unsmoothed.
Their equivalence has a practical consequence: you will not find a hidden edge in choosing one over the other. What matters is how you use the reading.
What an extreme reading is supposed to mean
The conventional reading says values near 0 indicate overbought and values near -100 indicate oversold. The idea is that a close pinned to the recent high represents a stretched price, and one pinned to the low represents an exhausted price.
The problem appears when that reading is turned into an action rule. A close near the high also describes a strong trend, not only an excess. In a sustained trend, the indicator can stay in the extreme zone for a long time without price changing direction. That is why using an oscillator as an isolated signal is debatable, and the classic technical analysis literature, such as John Murphy's work, recommends reading it alongside trend context.
What the class test showed
In class, a rule based on the same kind of logic was coded: enter based on an oscillator condition on a stock index, with daily data from 2012 and commissions included. The instructor clarified that Williams' original strategies are no longer profitable, which is why the tested version was an adaptation.
The first version, with a one-candle exit, gave a poor result. Exploring other exits improved the curve a little, but with commissions included the drawdown was two or three times the annual return. With that ratio, the instructor's own conclusion was that, as it stood, it was not worth it.
These are results from a demonstration with an example rule, not a formal evaluation. But they illustrate something important: a well-known, well-defined indicator can produce no edge on its own, and costs can erase the little that seemed to be there.
Variants explored and their risk
To try to improve the rule, three changes were tested. One was a very short version of the RSI, two periods, which reacts immediately to the last move. Another was comparing the oscillator reading with the one from a candle earlier to measure its acceleration or deceleration. The third was changing the fixed position size.
Each variant adds parameters and decisions. The more of them are tested on the same history, the greater the chance one looks good by coincidence. This is known as backtest overfitting, and Bailey and coauthors describe it in a paper on the probability of backtest overfitting.
A three-step test
- Calculate the indicator by hand once. If you cannot reproduce the reading from high, low and close, you do not know what you are testing.
- Write the full rule before looking at results. What reading opens, what closes and how long the trade lasts.
- Test with costs and compare against doing nothing. If the rule does not beat the history without it, the indicator adds nothing.
An indicator is a way to measure, not to decide
The Williams %R is useful as a reading: it tells you where price closed within its recent range. What that fact means depends on context, on the asset and on the rule you build around it. Treating it as an order to buy or sell skips the hard part.
An indicator answers one specific question; if you do not know which one, the signal it gives does not mean what you think.
To learn to read and test indicators this way, the program Análisis Técnico Especializado en Indicadores (Specialized Technical Analysis of Indicators) works through them one by one: see the program.
Educational content. Cronoss is not a broker, investment firm or financial adviser, and nothing above is an investment recommendation.
Frequently asked questions
How is the Williams %R calculated?
Take the highest high and lowest low over a number of periods, subtract the close from the high, divide by the range and multiply by -100. A close at the high gives 0 and a close at the low gives -100.
What is the difference between the Williams %R and the stochastic?
They measure the same thing on different scales: the basic stochastic equals 100 plus the %R. In practice the stochastic is usually used with smoothed lines and the %R unsmoothed.
Does a reading near -100 mean price will rise?
Not necessarily. It means the close landed near the low of the recent stretch, which also happens in strong downtrends. That is why it should be read with trend context and the rule tested on data.
Why is the Williams %R negative?
Because the formula multiplies the distance to the high by -100. In class people speculated it was chosen for visual clarity, but it does not change what it measures.


