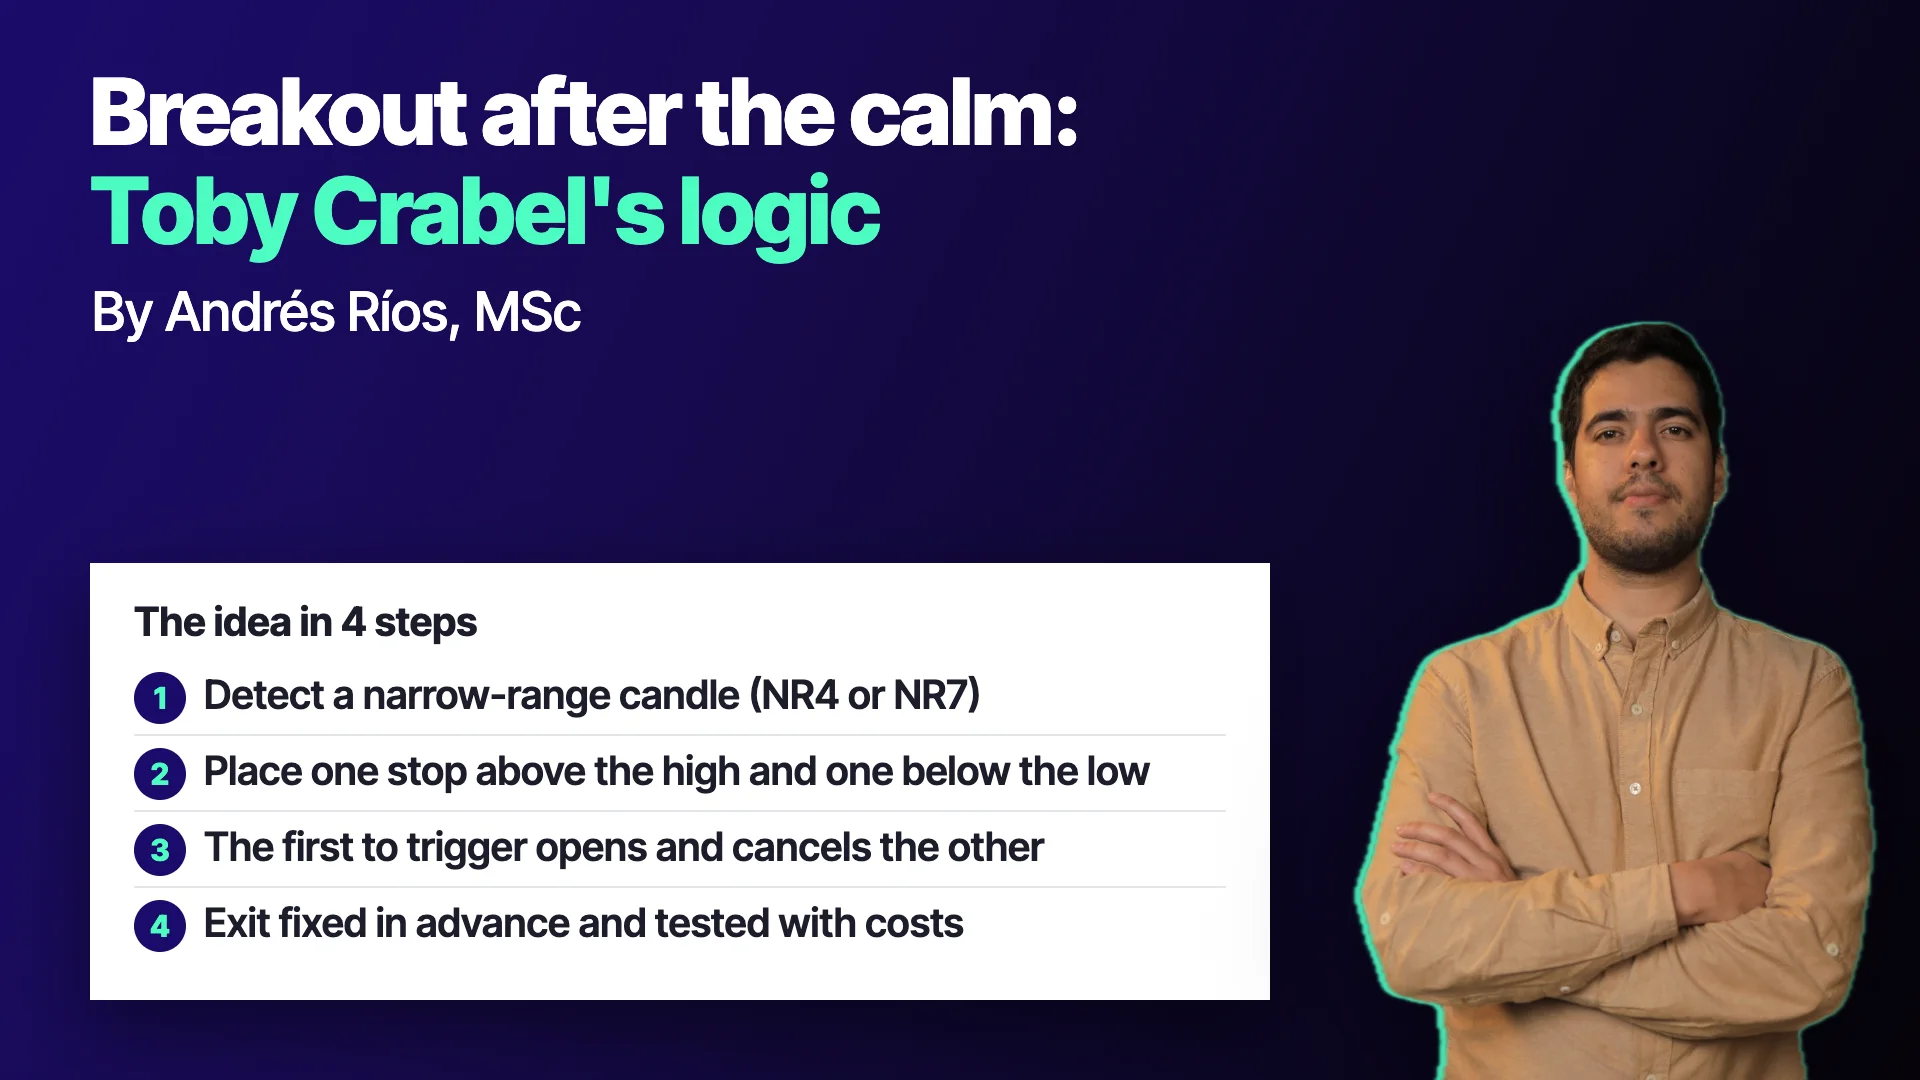
Key takeaways
- NR4 and NR7 flag a candle with the smallest range of the last four or seven, under the hypothesis that contraction precedes expansion.
- The two-stop version lets the market choose the side and uses the breakout as a natural entry filter.
- The order offset decides how many signals fire, and moving it to improve the curve is a way of fitting the rule to the data.
- When markets moved to nearly 24 hours, volatility was diluted outside the main session and the pattern lost strength.
- Pure price-action patterns allow few robustness tests, so watching them in real time before trusting them is sensible.
After several days in which price barely moves, does a big move tend to follow? That question underlies a family of strategies studied for decades: breakouts after a volatility contraction. Two names come up almost every time in that conversation, Larry Williams and Toby Crabel.
What matters is not memorizing a pattern but understanding what it claims and how it is checked. A volatility breakout does not predict direction: it only bets that, after the calm, price moves, and it lets the market itself choose the side.
The core idea: contraction and expansion
Volatility is not constant. There are stretches where daily ranges narrow and stretches where they widen. The hypothesis is that a contraction tends to be followed by an expansion, and that the moment of change can be detected with simple rules.
That hypothesis has one virtue: it does not need to guess whether the move will be up or down. It is enough to prepare an entry for each side and activate whichever breaks first. In class it was presented as one of the few relatively predictable things in markets, and it deserves caution: relatively does not mean always.
Crabel's pattern: NR4 and NR7
Toby Crabel documented variants of this idea in his book Day Trading with Short Term Price Patterns and Opening Range Breakout, published in 1990 and cataloged in Open Library. Two of them are well known.
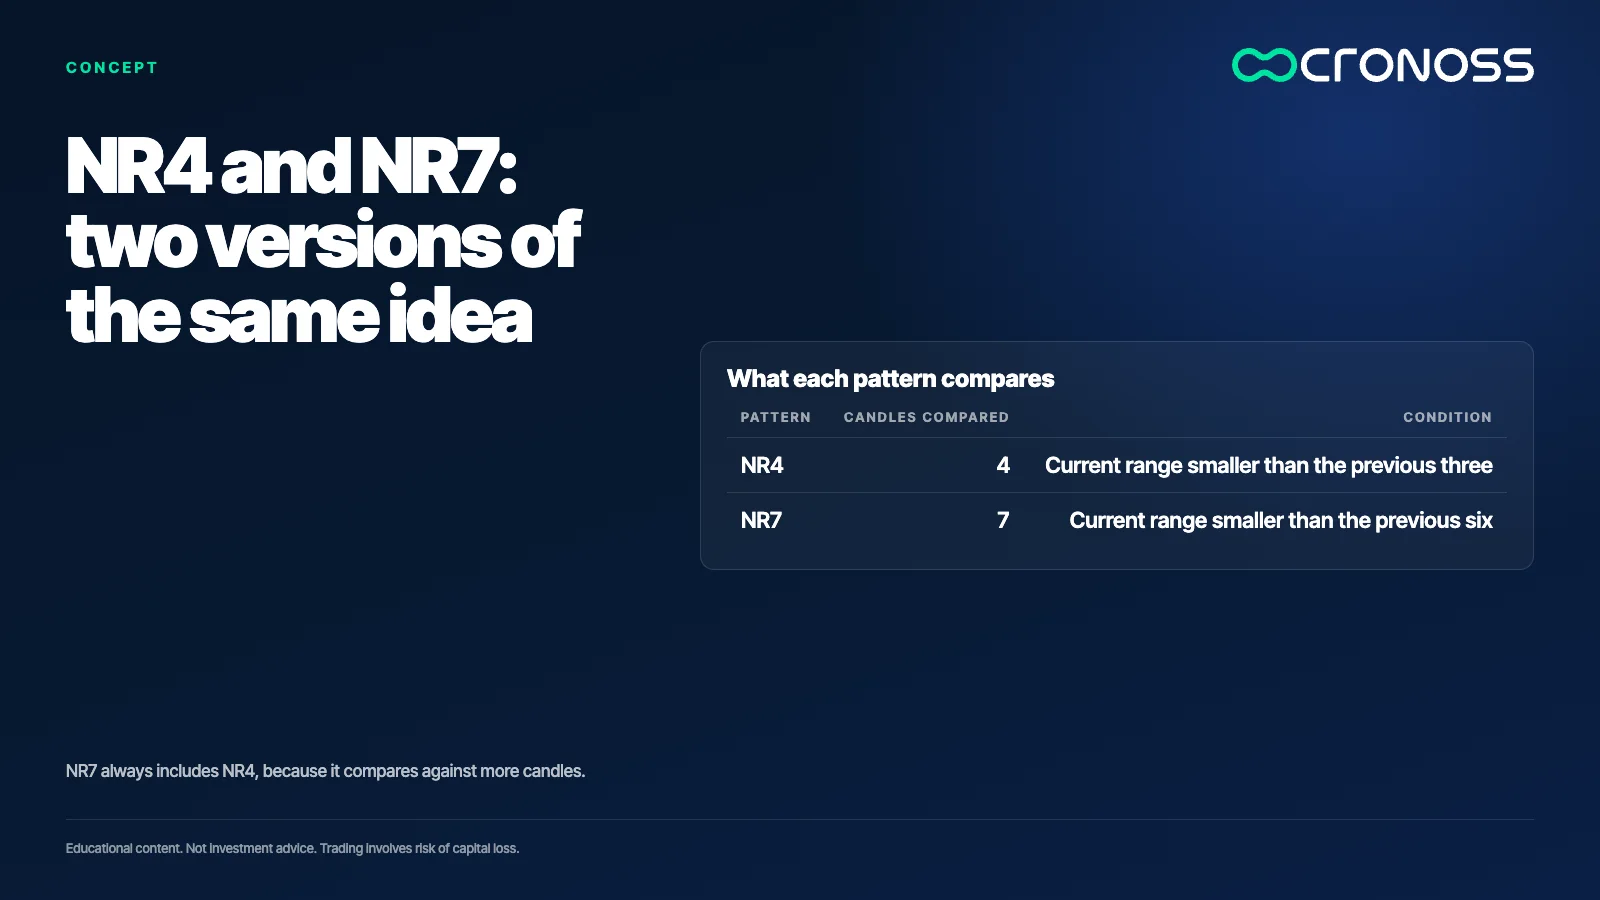
The NR4 (narrow range 4) occurs when the current candle's range, measured high to low, is the smallest of the last four candles. The NR7 does the same with seven candles. Because NR7 requires comparing against more candles, it always includes NR4: if there is an NR7, there is an NR4.
One point clarified in class: NR4 is not the same as a pennant. It only requires the candle's range to be the smallest of the group, without requiring it to sit inside the previous ones.
From signal to entry: two stop orders
The original rule went long as soon as the signal appeared. Over time, as that edge weakened, the most common version moved to placing two stop orders: a buy stop above the candle's high and a sell stop below its low, to bracket price. Whichever triggers first opens the trade and cancels the other.
This changes the nature of the rule. The stop order works as a natural filter: you do not enter until price confirms a move. And the offset of the level (higher, lower, closer or farther) decides how many signals fire, which is another knob that can be fitted to the history.
An intraday variant and its reference point
Another class explored the volatility breakout Williams described in his books. The concept: after a candle that engulfs the previous one, stops are placed above and below, at a distance that depends on recent volatility, measured with an indicator such as ATR.
In the studies described, the best-performing reference point was not the close, the high or the low of the previous candle, but the open of the current session. The practical reason is that gaps between the close and the next open distort the statistics. The most efficient exit was tested at the end of the session.
To automate it you need two data series: a daily one, to compute volatility, and an intraday one, to locate the session open and close.
What the class tests showed
In the demonstration, with a large offset the strategy entered only 4 times over the five-year history: the threshold was so high it was almost never reached. Lowering it to half of the volatility produced many more entries, but it lost; with a small offset, a fraction of the volatility, a more stable curve appeared with enough trades to study.
These are values from a class example. What matters is the mechanism: the offset is a filter, and moving it to find the best curve is a way of fitting the rule to the data. The instructor himself warned that with a very low offset there would be many false entries, and that the test should be complemented with other kinds of filters.
The ways it can fail
- Many false entries. A breakout can trigger on an isolated volatility spike and then reverse.
- A changed market. When markets moved to trading nearly 24 hours, volatility was diluted outside the main session and the pattern lost strength, as explained in class.
- Noise on very short timeframes. At five minutes you capture more noise than signal, and machines with far more capacity compete in that arena.
- Limited robustness tests. Pure price-action patterns have no parameters that can be randomly recombined, so some modern overfitting tests do not apply. One alternative mentioned was to watch the rule in real time for several months before giving it credit.
A four-step test
- Write the contraction with numbers. For example, a range smaller than the previous candles', and decide once how many.
- Define both entries and the exit before looking at results. The level of each stop order and the moment of closing.
- Count the signals. If the filter leaves only a few dozen, conclude nothing: change asset or timeframe only if you decided that in advance.
- Test with costs and in another period. A rule that works only without commissions or in one era is not an edge.
A calm spell does not always end in a storm
After the contraction, the move may come, or not. Crabel's logic offers an orderly way to ask about volatility, but that question must be answered with data, costs and several periods, not with the elegance of the pattern.
A breakout pattern does not promise movement: it only prepares a way to react to it, and that reaction has a cost the test must measure.
If you want to go deeper into how these rules are built and evaluated, the program Análisis Técnico Avanzado de Mercados Financieros (Advanced Technical Analysis of Financial Markets) develops them step by step: see the program.
Educational content. Cronoss is not a broker, investment firm or financial adviser, and nothing above is an investment recommendation.
Frequently asked questions
What is the NR4 pattern?
It is a candle whose range, high to low, is the smallest of the last four candles. NR7 applies the same idea with seven candles. Both try to detect a volatility contraction before a possible expansion.
Is NR4 the same as a pennant?
No. NR4 only requires the candle's range to be the smallest of the group, without requiring it to sit inside the previous candles as a pennant does.
Why use two stop orders?
Because the pattern does not predict direction. A buy stop above the high and a sell stop below the low let price choose the side: whichever triggers first opens the trade and cancels the other.
Does Crabel's pattern still work?
There is no general answer. Class explained that the pattern lost strength as markets moved to nearly 24-hour trading, so any current use must be tested on recent data, with costs and across several periods.


