Key takeaways
- The Turn Around Tuesday rule combines a calendar bias with a wide red Monday candle and a stop-order entry.
- A calendar effect is proven when it survives tests built to refute it, not because it shows on a chart.
- Testing many variants on the same data makes it almost certain that one looks good by chance, even with no real effect.
- Repeating the rule on a similar asset without retuning is a practical way to check whether the finding travels.
- A too-pretty curve should be examined until you understand where it comes from, since repeated entries or badly modeled costs can create it.
Some days of the week seem to behave differently from others. If Monday drops hard, does Tuesday tend to bounce? The idea has its own name, Turn Around Tuesday, and comes from the strategies trader Larry Williams described in his books.
It is an attractive question because it can be answered with data. But it is also the ground where a real finding is most easily confused with a coincidence. A calendar effect is not proven because it shows up on a chart: it is proven when it survives a test designed to refute it.
What does the Turn Around Tuesday rule say?
The rule combines two elements. The first is a calendar bias: Tuesday. The second is a price condition: Monday must have closed with a red candle of wide range, that is, a drop larger than usual.
With those two conditions, the entry is a long position on Tuesday, through a stop order placed at the high of Monday's red candle. If price rises to that level, the trade is triggered. The original exit was simple: close after one day.
Notice the design. The whole rule rests on one candle and one day of the week. Williams usually worked this way, with minimal structures of one to five candles, no stack of indicators. That simplicity has an advantage: there is very little to tune. And a cost: every piece of the rule carries a lot of weight.
What is a calendar effect, and why is it a hard hypothesis?
A calendar effect is the claim that a certain day, month or date behaves differently from the rest. In the stock market, the so-called weekend effect has been studied in the academic literature; French's 1980 paper on the subject is a classic reference.
Behind effects like these there is usually a plausible explanation. The class discussed, for example, that Monday might be a day when some participants unwind positions to raise liquidity, which would make a clear trend harder. These are reasonable conjectures. But a convincing explanation does not replace evidence: the effect may be real, may have faded over the years or may never have existed.
The problem of searching until you find something
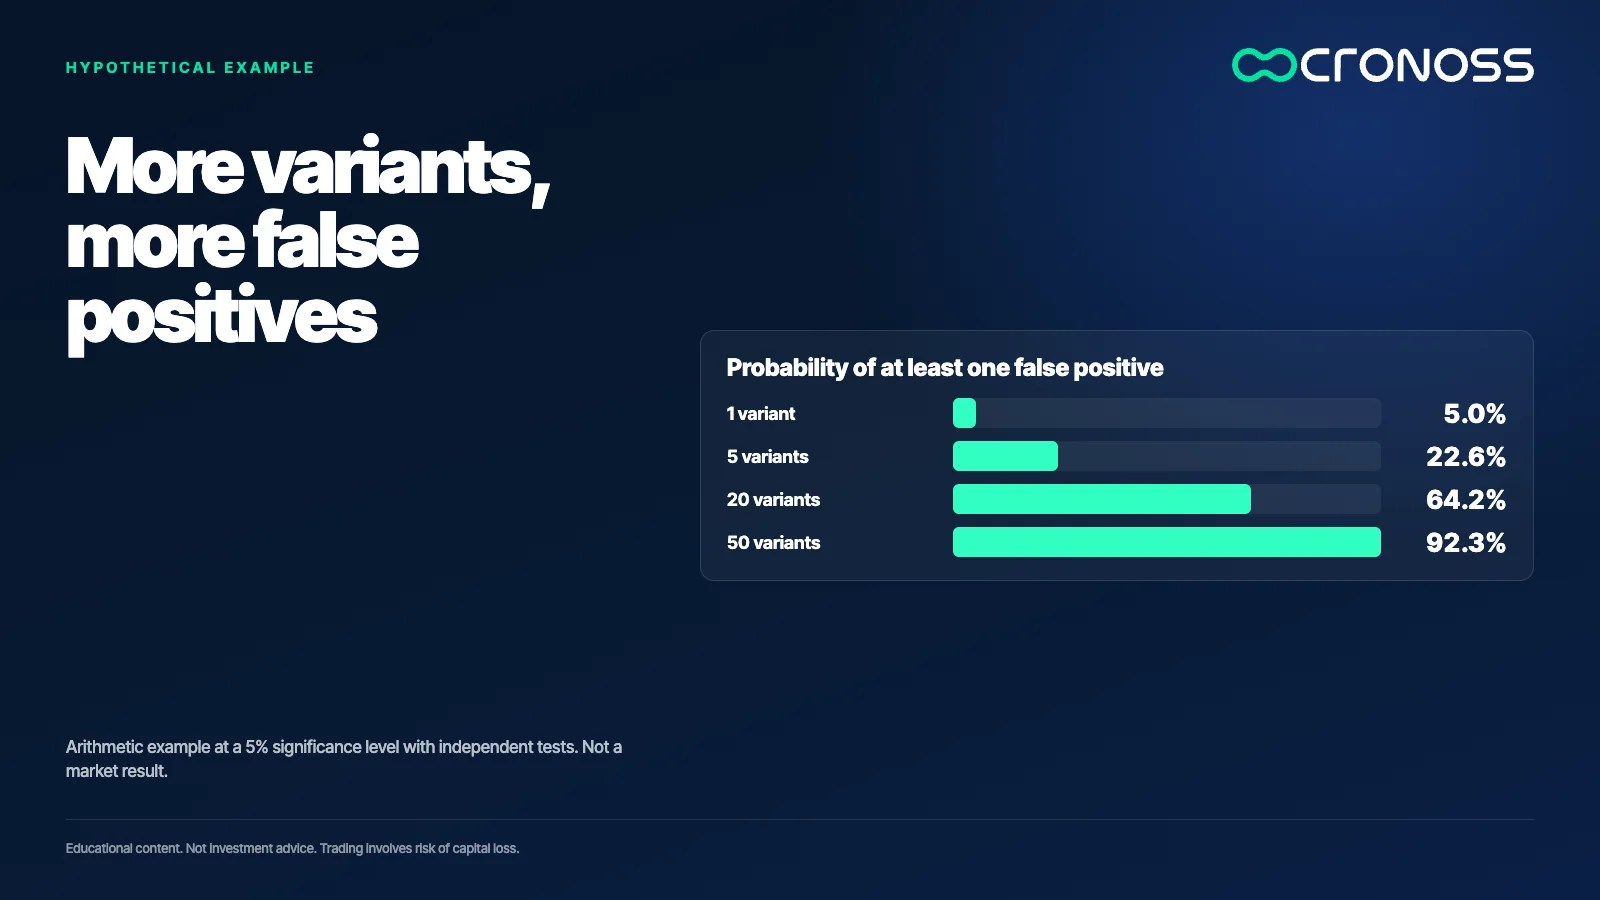
Here the central risk appears. If you test every day of the week, several candle filters, several exits and several assets, you are running many tests on the same data. Some will look good by pure chance.
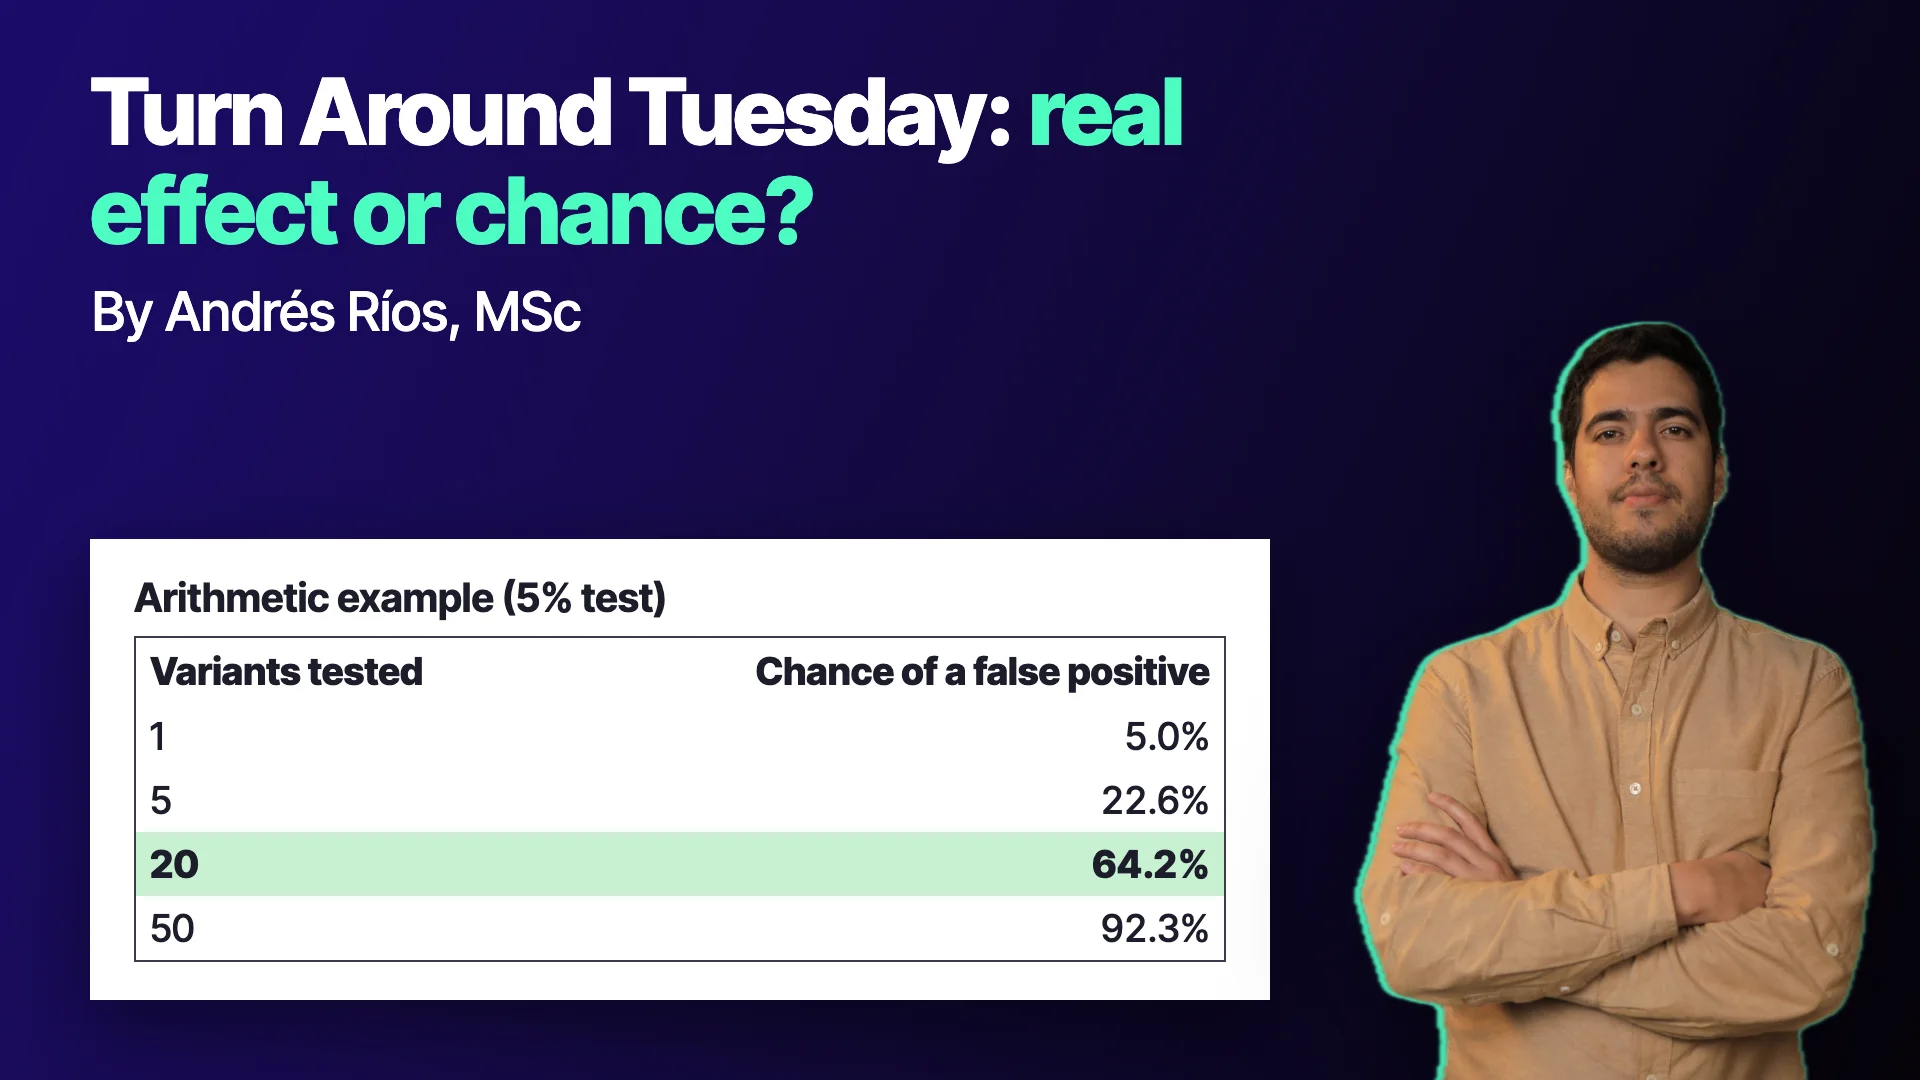
A worked calculation, at a 5% significance level per test: the probability of at least one false positive is 1 minus 0.95 raised to the number of variants. With 1 variant it is 5.0%; with 5 variants, 22.6%; with 20 variants, 64.2%; with 50, 92.3%. It is an arithmetic example, not a market result, and it assumes independent tests.
Sullivan, Timmermann and White studied exactly this danger in stock market calendar effects: their paper's title refers to the dangers of data mining. The lesson is not that calendar effects do not exist, but that the evidence for them must be adjusted for everything that was tried before finding them.
What the class test showed
In the class demonstration, the original rule, as described, without filters or tweaks, was not profitable over the tested history, which included commissions. After some changes, including moving the entry level, the result improved.
That calls for care. Each change was another decision made while looking at the result. The instructor himself warned about it: with only 66 trades in the index history, the sample was small. He cited a rule of thumb that you need at least 30 trades per degree of freedom of the strategy. With 66 trades and several parameters, the sample fell short.
To widen the evidence without touching the rule, the same design was tried on a second, similar index, which added 75 trades. That is good practice: repeating on a similar asset without retuning anything is a way to check whether the finding travels.
Why a too-pretty curve should raise suspicion
The class included an instructive moment. When the rule was moved to one-hour candles, the curve improved dramatically. The instructor explained that the system was probably entering several times on the same Tuesday, repeating the condition in each cycle, and capturing small stretches of the move.
His reaction was cautious: when a curve looks that good, you have to examine it until you understand where it comes from. Often, looking deeper, you find the reality behind the curve. An entry that repeats without limit, badly modeled costs or a data structure that does not match real execution can manufacture a result that does not exist.
A four-step test
- Write the hypothesis before looking at the data. "After a wide-range down Monday, Tuesday tends to rise" is a hypothesis. "Let's see which day works" is not.
- Count how many variants you tested. Every day, filter and exit counts. That number defines how much evidence you need.
- Validate out of sample and on a similar asset. Without retuning anything. If the result disappears, it was not robust.
- Include costs and distrust perfect curves. Check how many trades occur per day and whether any repeat unrealistically.
The calendar does not replace method
Turn Around Tuesday is a good example of how an idea with logic can be a good hypothesis and, at the same time, a minefield of biases. The behavioral explanation, the simple rule and the low number of parameters are strengths. The temptation to tune until it works is the risk.
A calendar pattern is worth what its test is worth: if you do not know how many times you tried, you do not know how much to trust it.
To learn to design and evaluate strategies with this rigor, the program Fundamentos del Trading Sistemático (Fundamentals of Systematic Trading) builds the basics step by step: see the program.
Educational content. Cronoss is not a broker, investment firm or financial adviser, and nothing above is an investment recommendation.
Frequently asked questions
What is Turn Around Tuesday?
It is an idea attributed to Larry Williams under which, after a Monday that closes with a wide-range red candle, Tuesday tends to rebound. The rule goes long with a stop order at the high of Monday's candle.
How do I tell a real calendar effect from a fluke?
By counting how many variants you tested and demanding evidence proportional to that number. With 20 variants at a 5% level, the chance of at least one false positive is 64.2%, so validate out of sample and on a similar asset.
How many trades do I need to trust a strategy?
Class cited a rule of thumb of at least 30 trades per degree of freedom of the strategy. With 66 trades and several parameters, the sample was considered insufficient.
Why distrust a very good curve?
Because it can hide repeated entries, badly modeled costs or data that does not reflect real execution. In class, the one-hour version improved dramatically because it was probably entering several times on the same Tuesday.


