Key takeaways
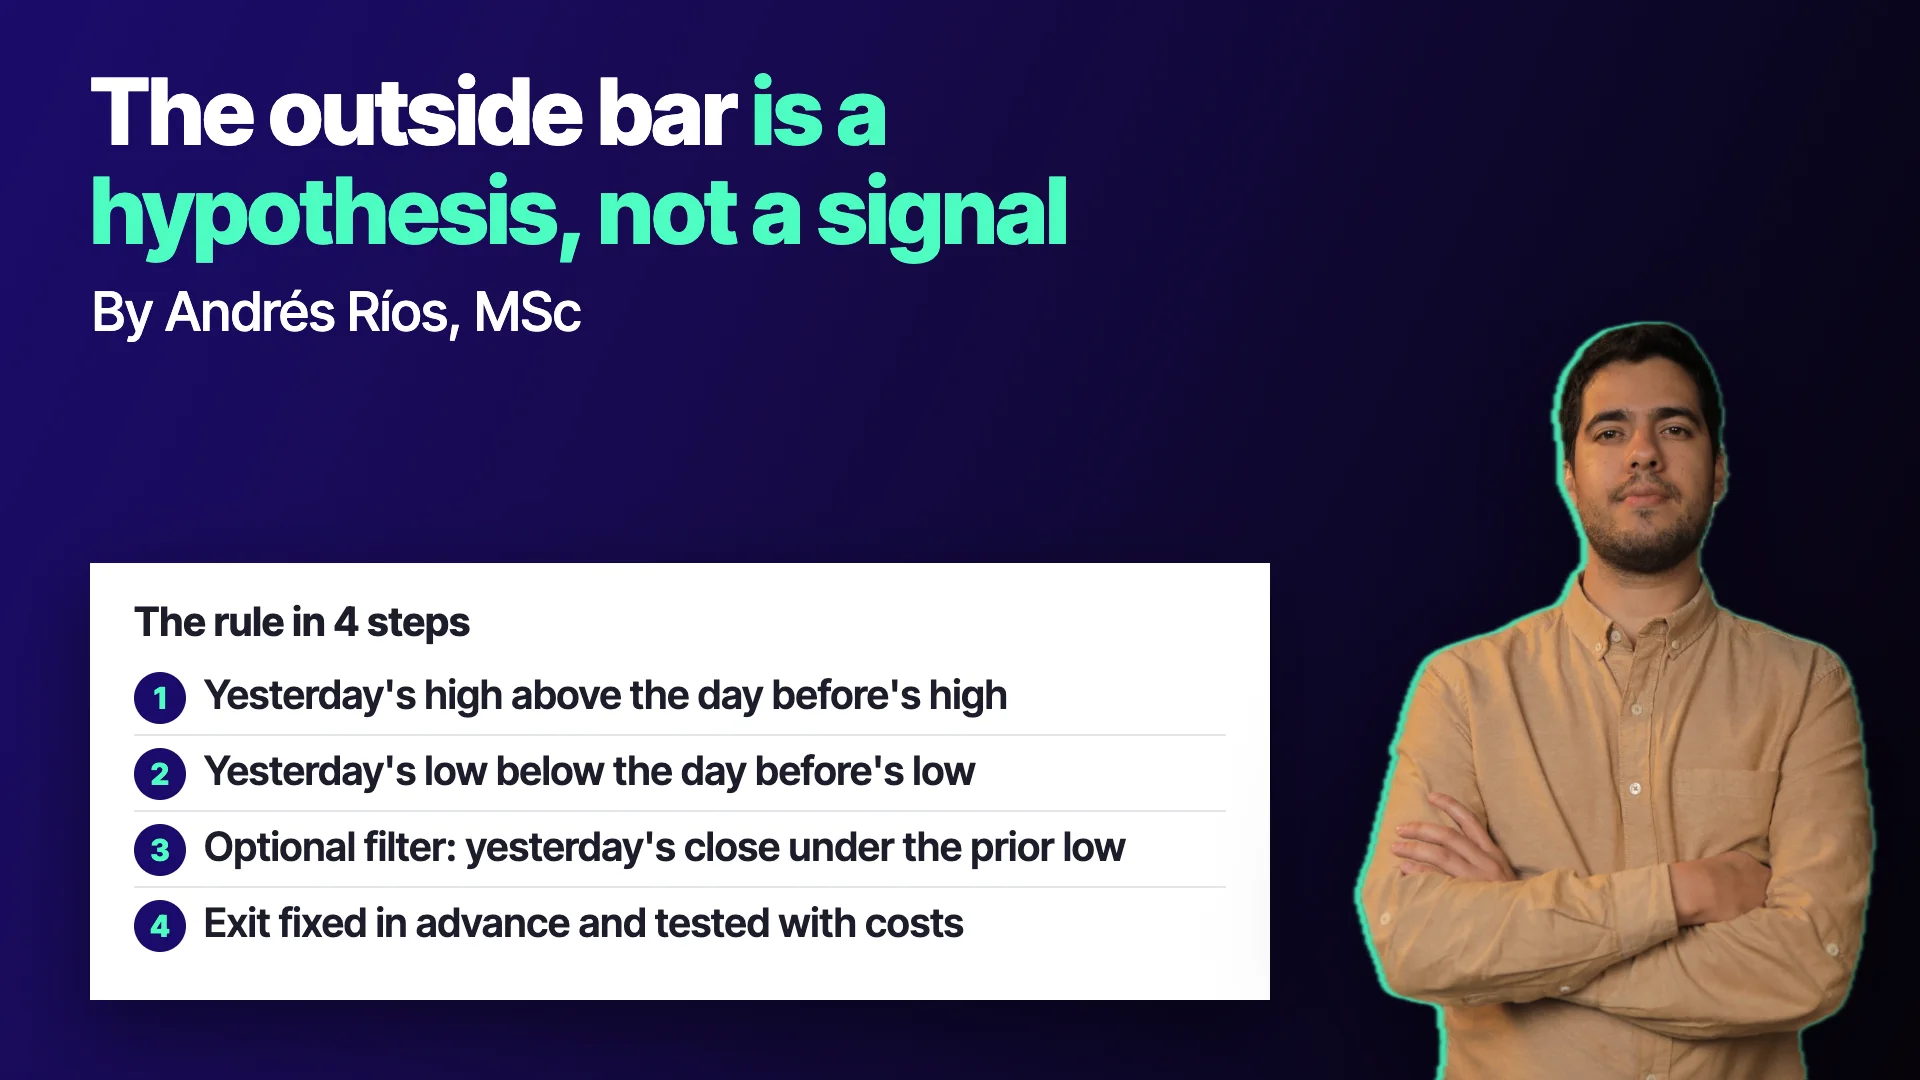
- An outside bar exceeds both the high and the low of the prior candle; defined only with prices, it can be programmed and tested.
- Every added condition reduces the number of signals, and with only a few dozen trades no statistic is reliable.
- Testing many variants on the same data raises the odds that the best one is a coincidence.
- An exit that waits for a loss to reverse resembles a martingale and hides a deep drawdown.
- Before trusting a rule, add costs, test out of sample and measure the worst stretch, not just the average.
A daily candle that leaves the previous day's high below it and the previous day's low above it looks like a minor chart detail. For some traders it became the basis of a full rule. For others it is just a big candle nobody manages to turn into anything measurable.
The difference between the two views is not the pattern. It is whether the idea is written as a precise rule and put through a test that can fail. The outside day, or outside bar, is not a signal: it is a hypothesis with conditions that can be defined, measured and rejected.
What is an outside bar, and how do you define it without ambiguity?
An outside bar is a candle whose high is above the previous candle's high and whose low is below the previous candle's low. In other words, it fully engulfs the prior day's range. It is the same structure known as an engulfing candle, but defined only with prices, ignoring color and body.
That definition has one advantage: it can be programmed. You only compare two highs and two lows. Someone reading a chart by eye may wonder whether a candle "engulfs enough"; a written rule leaves no room for that doubt.
The method was popularized by the American trader Larry Williams, who described it in his books on short-term trading. One of them, Long-term secrets to short-term trading, is cataloged in Open Library. What follows explains the logic and the test, not a recommendation to trade.
The first version of the rule and its problem
The simplest version says: if yesterday's bar engulfed the one before it, open a long position and close it at the end of the next day. No target and no loss limit, only a one-day horizon.
When that idea was loaded into a testing platform, a technical detail appeared that became a lesson in class: comparing today's high with yesterday's high can fail if the platform's engine treats both prices as the same value at the candle change. The fix was to rewrite the condition as a subtraction: yesterday's high minus the high before it greater than zero, and the low before it minus yesterday's low greater than zero.
That is a good reason not to trust a rule that "looks right" until you see it produce real trades on the data. What looks like the same pattern can be coded in ways that are not equivalent.
Look at the data before the rule
Before testing anything, look at the data. The class recalled Anscombe's quartet: four datasets with the same averages, the same regression line and the same coefficient of determination, but completely different shapes when plotted. The original paper was published in The American Statistician in 1973.
The practical lesson: a statistical summary does not replace looking at the series. Some assets trade rarely, have gaps in their data or show isolated jumps that make something look significant when it is not. If the quality of the history changes across the years, the test result changes with it.
An added condition: the close outside the range
On its own, the outside bar produced a curve in the class demonstration that stayed near zero. That reads as the pattern not destroying capital by itself, but also not proving a clear edge.
Williams' improvement was to add a condition: the previous bar's close must sit below the low of the bar before it. The idea is to isolate cases where price moved away from its recent zone. The hypothesis behind it is mean reversion: after an extreme move, price tends to drift back toward its average.
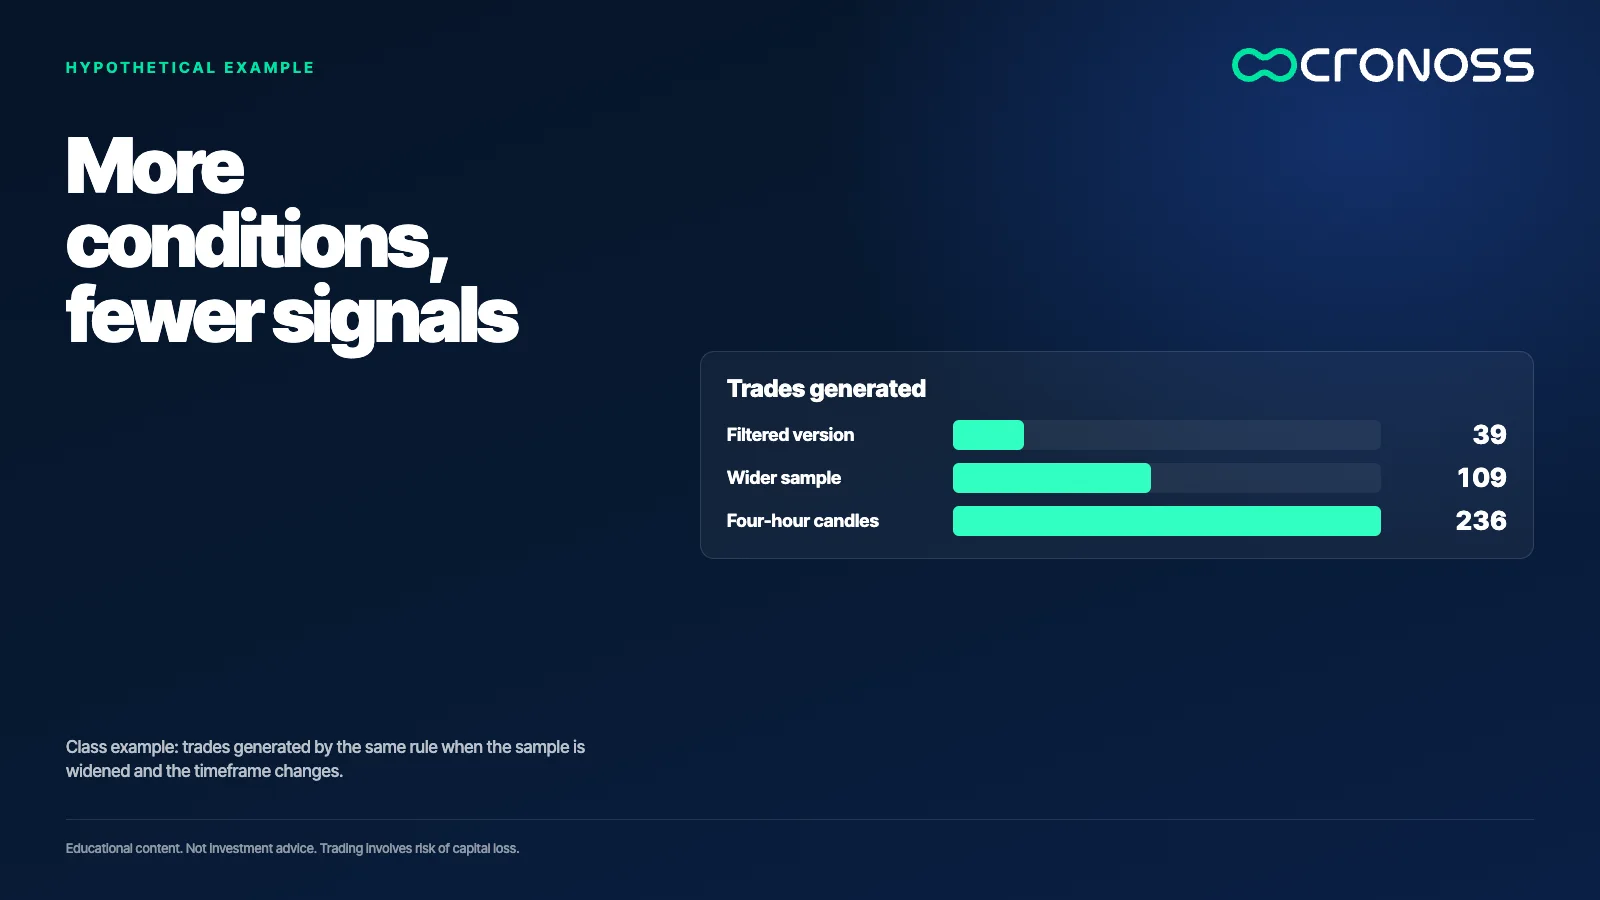
Every added condition reduces the number of signals. That matters more than it seems.
More conditions, fewer trades, more risk of fooling yourself
In the class demonstration, the filtered version produced 39 trades over the tested history. With so few observations no statistic is reliable: a short streak can explain the whole curve. It is a class example, not a result that can be extrapolated.
After widening the sample and moving to four-hour candles, the same pattern reached 109 and then 236 signals. With more observations you can compare meaningfully and see whether the behavior holds. But a new risk shows up: trying many variants until one works is a way of fitting the rule to noise.
This is known as backtest overfitting. Bailey and coauthors formalized it in a paper on the probability of backtest overfitting, with one central idea: the more configurations you test on the same data, the more likely the best one is a coincidence.
The exit decides what you are testing
Williams proposed an exit called a bail out: do not exit by time, but close on the first day the trade is in profit. In class, that condition smoothed the test curve a lot.
The instructor was clear about the cost, though: an exit that waits for the loss to reverse resembles a martingale, because the losing trade is held until it recovers. The risk is a deep, long drawdown. When a loss limit was added, the apparent edge dissolved in several tests, and only reappeared with more data and a tuned limit size.
An exit built on "faith that price comes back" is not risk management. It is a bet that the pattern plays out in time, and the test must measure how much the account can take if it does not.
What is missing before trusting a rule like this
The demonstration left out commissions and spreads on purpose, because the goal was to see whether there was anything worth studying. A real rule must go through tests with execution costs, different spread scenarios, out-of-sample data and robustness checks such as walk-forward analysis or Monte Carlo simulations.
Also, a pattern known for decades loses part of its edge when many people trade it. That something worked in one era does not mean it works now.
A three-step test
- Write the rule with exact prices. High, low and close of each candle, no adjectives. If two people code it and get different signals, the rule is not well defined.
- Count the signals before looking at the result. If there are only a few dozen, there is no basis to conclude anything. Enlarge the sample or accept that you cannot decide.
- Test what happens when the rule fails. Measure the worst stretch, not only the average, and repeat with costs and on data you did not use to tune it.
An engulfing candle is not an answer
The value of the outside day lies in what it teaches about method: a market idea becomes useful when it can be written, counted and refuted. The pattern can be a starting point; the test decides whether it deserves more attention.
A rule that cannot fail a test is not a rule, it is a belief.
If you want to go deeper into how rules like this are built and evaluated, the program Análisis Técnico Avanzado de Mercados Financieros (Advanced Technical Analysis of Financial Markets) works through them step by step: see the program.
Educational content. Cronoss is not a broker, investment firm or financial adviser, and nothing above is an investment recommendation.
Frequently asked questions
What is an outside bar or outside day?
It is a candle whose high is above the prior candle's high and whose low is below the prior low, so it engulfs the full range. It is defined only with prices, ignoring color, so it can be programmed and tested.
Is the outside bar a buy signal?
No. It is a hypothesis that must be tested with precise rules, enough observations and costs included. On its own it proves no edge.
How many trades do I need to draw conclusions?
There is no magic number, but with only a few dozen trades a short streak can explain the whole curve. The more conditions you add, the fewer signals you get and the less reliable the result.
What is backtest overfitting?
It is fitting a rule to the noise of historical data by trying many variants until one works. The more configurations are tested on the same data, the more likely the best one is a coincidence.


