Key takeaways
- The chart shows what already happened; research adds what is scheduled and the context that can change the game.
- Technical analysis answers when and at what price; fundamental analysis answers why and in which direction.
- The economic calendar gathers the world's official schedules and warns days ahead when movement is likely.
- Every event is read with three numbers: previous, consensus and actual; the same number tells different stories depending on context.
- Sources are filtered by level of trust, from reference agencies down to social media that require verification.
Two traders look at exactly the same chart: the same candle, the same moment, a clean structure. The first sees only the screen. The second sees the same thing, but also knows that in 30 minutes the US central bank announces its rate decision.
On the chart they are seeing the same thing, pixel for pixel. In reality, they are not. One sees calm; the other sees the calm before an event announced with a date and a time.
Research means getting informed about what is happening and what is about to happen in the world that moves your screen, and it does not require being an economist: it requires knowing where to look and how to read what you find.
Why does looking only at the chart leave you blind?
It is true that price reflects information: every buy and every sell was made by someone for a reason. But the chart shows the footprints of what already happened. It does not show what is scheduled to happen or the context that can change the game at any moment.
Phrases like "price discounts everything" sound professional and are comfortable, because they save the work of getting informed. They are half a truth. In other professions, deciding without information is considered reckless: a doctor reviews the medical history and a pilot checks the weather before taking off.
Two lenses for the same market
Technical and fundamental analysis do not compete: they answer different questions.
- Technical: studies the chart (candles, trends, support, resistance, patterns). It answers when and at what price: where it makes sense to enter, where an idea is invalidated.
- Fundamental: studies what lies behind the price (employment, inflation, central bank decisions, rates, global context). It answers why and in which direction.
A useful way to see it is a car: fundamental is the engine, which gives the force and the general direction; technical is the steering wheel, which gives fine control on each curve. A powerful engine without a wheel is no use, and a perfect wheel with the engine pulling the other way is no use either.
The economic calendar: the market's agenda
Economic data does not appear whenever someone feels like it. Governments and official institutions publish it on a schedule. The economic calendar gathers all those schedules from around the world in one place, in order.
That means the events that move markets are not a surprise as to timing: you know days ahead when movement is likely. The only unknown is the result. Two free and widely used platforms are Forex Factory and Investing. The information is the same because it comes from the same official sources; only the presentation changes, so the choice is one of comfort.
How to read a calendar row
The table can be intimidating, but its logic is simple. Each row is an event and carries five things:
- The time of publication.
- The country or economy of origin, shown with a flag or its currency code.
- The event name, meaning which release it is.
- The impact level, marked with colors or icons, which separates minor releases from those that can move the market a lot.
- The numbers of the release, read in three parts.
Previous, consensus and actual
Every event is presented with the same three numbers, so you learn to read them once:
- Previous: the result of the last publication. It is the memory of the release.
- Consensus (also forecast or estimate): the average of the projections of analysts and economists. It is the market's collective expectation.
- Actual: the number published at the time of the event.
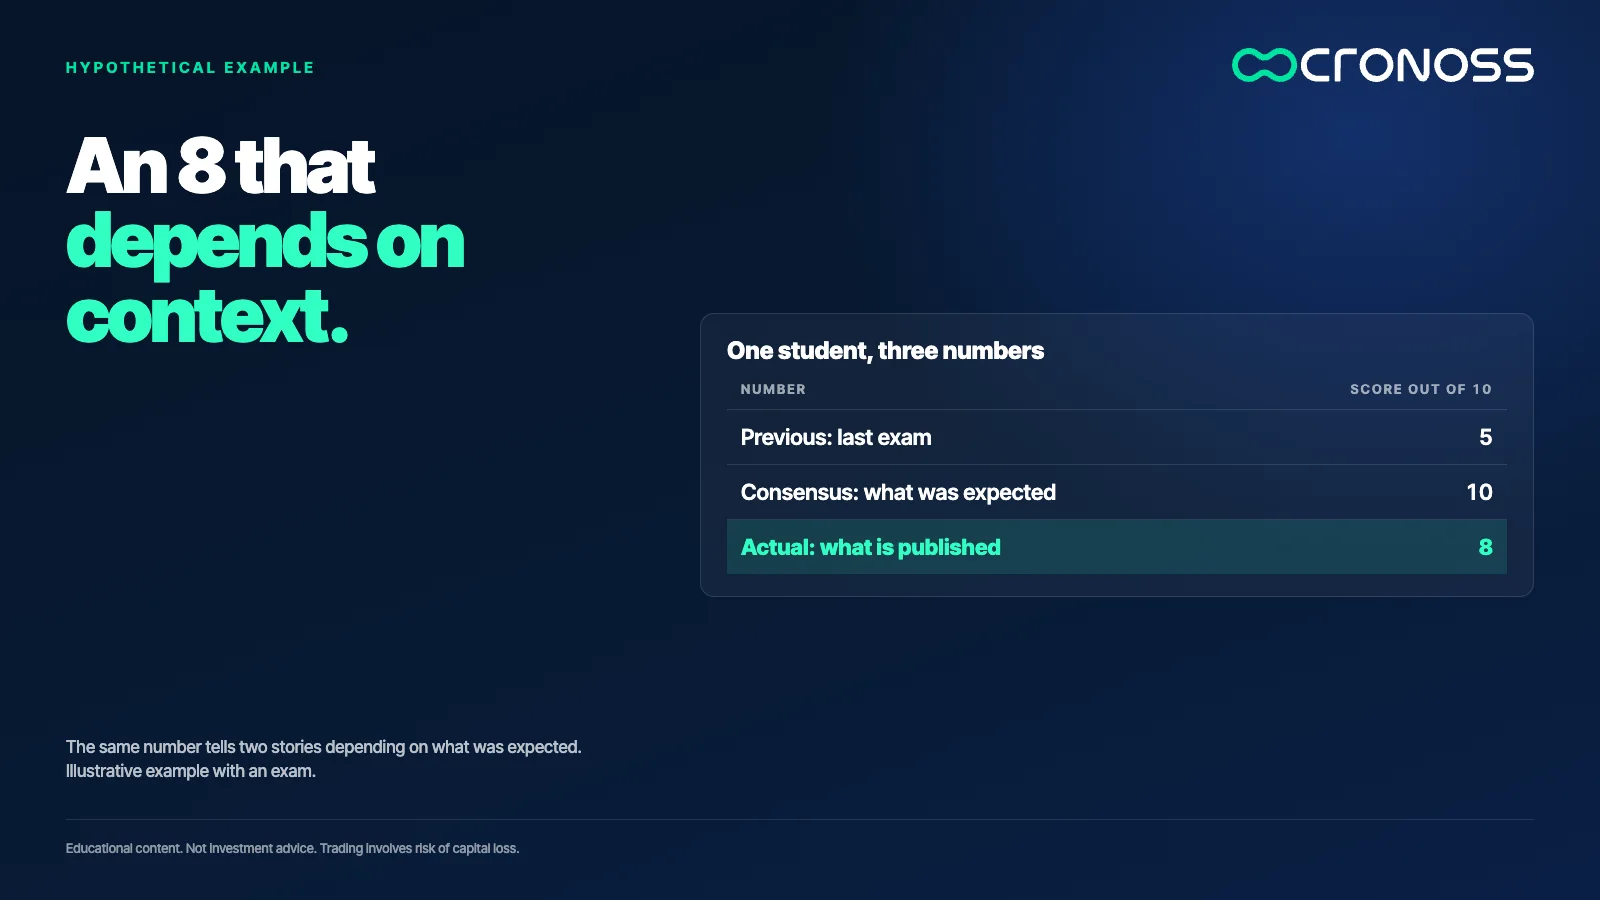
Why do you need all three? A student scores 8 out of 10. If on the last exam they scored 5, it is a great improvement. If everyone expected a 10, it is a disappointment. The same number tells two stories depending on context.
Not all sources are worth the same
The calendar covers what has a date. But there are stories that move markets without a schedule: tension between countries, a crisis, an unexpected move by a central bank. For those you need news sources, and today there is more information, and more informational junk, than ever. Think of them in levels of trust:
- Reference: agencies such as Bloomberg and Reuters, with decades of history and rigorous verification, because their business depends on credibility.
- Daily use: portals such as Investing or Yahoo Finance, free and fast, useful for the routine check.
- Looking up terms: Investopedia, a kind of financial encyclopedia to learn the language of markets.
- Social media: they have a real advantage, speed, but require verification before you trust them.
A three-step research routine
- Open the calendar and review which high-impact events are coming this week and from which countries.
- Note the previous and consensus of the events that affect what you trade, before the actual comes out.
- Cross-check with a reference source when there is news outside the calendar, before acting on it.
This routine organizes information, but it does not remove risk: trading the markets involves a risk of loss.
Getting informed is part of the strategy
Someone who researches before trading does not guess better. They avoid finding out about the storm when the price has already blown up in their face and blaming their strategy, their broker or their luck.
The difference between the two traders at the start is not talent or experience: one did research and the other did not.
To learn this method step by step, from the calendar to employment, inflation and growth data, take a look at the program Fundamentos de Research para Trading (Research Fundamentals for Trading): Fundamentos de Research para Trading.
Educational content. Cronoss is not a broker, investment firm or financial adviser, and nothing above is an investment recommendation.
Frequently asked questions
What is research for trading?
It is getting informed about what is happening and what is about to happen in the world that moves prices, before making a decision. It does not require being an economist: it requires knowing where to look and how to read the data.
What is the economic calendar?
It is an agenda that gathers the dates and times at which governments and official institutions publish economic data and decisions. It lets you know days ahead when volatility may arrive.
What do previous, consensus and actual mean?
The previous is the result of the last publication, the consensus is the average of analysts' projections and the actual is the published number. They are read together because the same number means different things depending on context.
Which information sources are reliable for trading?
Reference agencies such as Bloomberg and Reuters have the highest level of verification. Portals like Investing or Yahoo Finance work for the daily check, and social media requires verification before you trust what it posts.