
Key takeaways
- The market reacts to the distance between the actual number and the consensus, not to the number itself.
- Every event has three figures: previous, consensus and actual; the consensus is already priced in.
- The CPI is read as monthly and annual change, and as headline and core, because each combination tells a different story.
- Rate expectations move before rates do, and scenarios are analysis hypotheses, not predictions.
- Risk appetite (risk-on and risk-off) is the frame that explains why different assets move together.
A very good jobs number comes out, better than the month before, and the market barely moves. The following week a mediocre number from another indicator is released and prices shake. It looks incoherent, but there is an explanation that organizes almost all macroeconomic analysis.
The market does not react to the number: it reacts to the distance between the number and what it already expected.
Why can a good number move nothing?
Because the market does not wait for things to happen before moving: it anticipates. Every economic event has three figures: the previous (the earlier reading), the consensus (what analysts expect) and the actual (what is published). The consensus is not a decoration on the calendar. It is the collective expectation of thousands of analysts and institutions, and those who move capital take positions based on it before the release.
When the number comes out, that expectation is already reflected in the price. The number is said to be priced in.
The surprise is the new information
If the actual matches the consensus, there is no new information: the market had already bet on it. That is why the move is usually small even when the number is good. If the actual departs from the consensus there is a surprise, and positions built on the wrong expectation have to be redone all at once. That mass adjustment is the volatility you see on the chart.
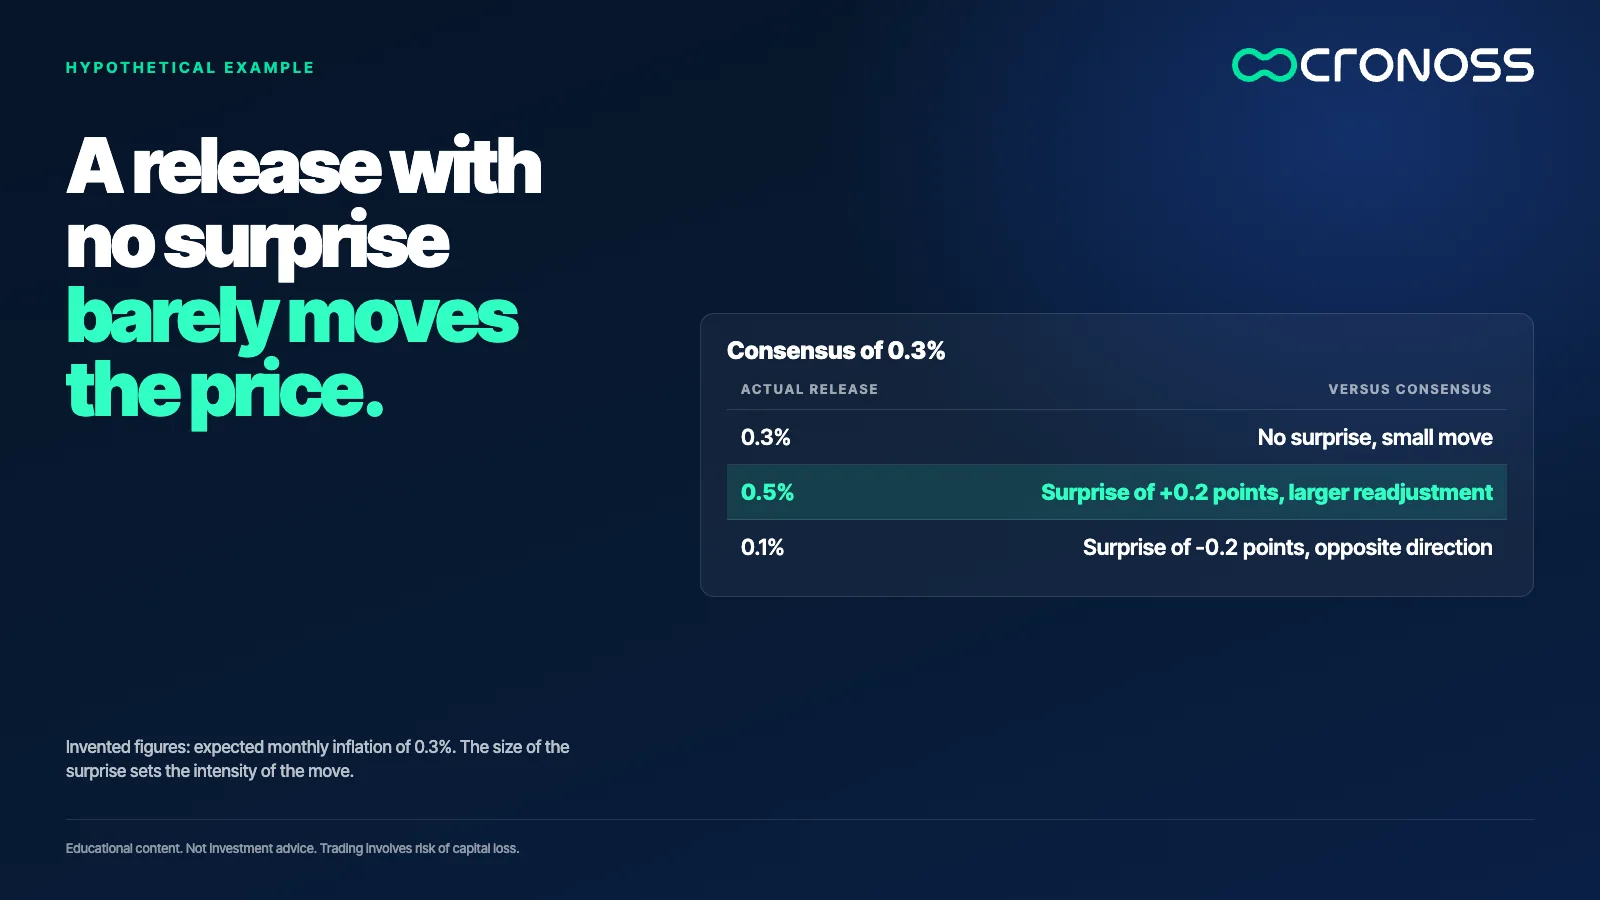
An example with invented numbers: expected monthly inflation is 0.3%. If 0.3% is published, the adjustment will be small. If 0.5% is published, the surprise is 0.2 points and the readjustment will be larger. If 0.1% is published, there is also a surprise, in the opposite direction. The intensity of the move tends to be proportional to the size of the surprise.
A better question than "will it be good or bad?"
A beginner asks whether the number will be good or bad, which turns them into someone guessing a figure. Someone with judgment asks what the market expects and how likely it is that reality departs from it. It is a different game, with more information available. And the previous reading counts too: it is often revised together with the new release.
How to read the CPI
The CPI measures inflation, and inflation is the central mandate of a central bank. That is why each CPI works like an exam: either it is where the bank wants it or it is drifting off course.
- CPI above the consensus. Inflation is hotter than expected. The market reads that the central bank could keep rates high for longer, which tends to support that economy's currency.
- CPI below the consensus. Inflation is easing faster than forecast. The bank gains room to cut, and that tends to weaken the currency.
These are tendencies, not rules. And they show something curious: falling inflation is good news for citizens but can take strength from their currency. The market reads data with rate logic, not household logic.
Two windows and two versions of the same number
The CPI is read as monthly and annual change. The annual figure gives the big trend; the monthly one shows recent speed. A high annual figure with monthly readings that are slowing tells a story of cooling. Reading only one gives a snapshot that can mislead.
It is also read as headline and core, which excludes volatile components such as energy and food. Central banks tend to watch core more, because they want to know whether underlying inflation is under control. That is why an acceptable headline can come with an adverse reaction if core comes in hot. In the CPI, tenths matter.
Markets are expectation machines
Expectations about rates move before rates do: with jobs data, inflation or the tone of a statement. Three scenarios work as a mental exercise, always as tendencies:
- Persistent inflation. The central bank keeps rates high for longer; bonds and growth stocks tend to feel pressure and the local currency tends to be supported.
- Inflation cooling. The probability of cuts rises; risk appetite tends to improve.
- Employment weakening unexpectedly. Rate-cut expectations accelerate; safe-haven assets tend to gain attention.
Each scenario is a hypothesis to organize the analysis, not a prediction of what will happen.
Risk appetite: the frame that ties it together
Above every number there is a global mood. In risk-on the market is confident and money seeks yield. In risk-off something frightens it, and the priority shifts from winning to not losing. There is no official signal announcing it, but there are converging clues: indexes falling across several regions, safe-haven assets rising and headlines dominated by fear. A single clue can mislead; several pointing the same way rarely do.
This explains why relationships that look fixed, such as the one between the dollar and gold, can change when fear is in charge instead of rates.
Before you consider a number understood
- Locate the three figures. Identify previous, consensus and actual before interpreting anything.
- Measure the surprise. Work out the distance between actual and consensus, and check whether the previous was revised.
- Ask where it comes from and how important it is. Check the impact level and the country of origin: each currency responds to news from its own economy.
This method organizes the analysis, but it does not remove uncertainty: trading the markets involves a risk of loss.
The right question is worth more than the quick answer
Someone who learns to read the distance between what was expected and what was published stops chasing headlines. They start to understand why the market does what it does.
The market pays for the surprise, not for the news.
To go through this method with the key releases (NFP, CPI, GDP, PMI, central banks), take a look at the program Análisis Macroeconómico para Trading (Macroeconomic Analysis for Trading): Análisis Macroeconómico para Trading.
Educational content. Cronoss is not a broker, investment firm or financial adviser, and nothing above is an investment recommendation.
Frequently asked questions
Why does a good economic number sometimes not move the market?
Because the market anticipates and the consensus is already reflected in the price. If the actual matches what was expected there is no new information, and the move is usually small even when the number is good.
What are the previous, the consensus and the actual?
The previous is the earlier reading, the consensus is what analysts expect and the actual is the published number. The three are compared to measure the surprise and read the market's reaction.
What is the difference between headline and core CPI?
Core excludes volatile components such as energy and food. Central banks tend to watch it more because it shows underlying inflation, so it can weigh more than the headline number.
What do risk-on and risk-off mean?
Risk-on is a state of confidence in which money seeks yield in risky assets. Risk-off is a state of fear in which the priority is protecting capital. They help explain why many assets move at the same time.