Key takeaways
- The policy rate works as the market floor and as the reference for pricing every other asset.
- Each asset demands a risk premium over that floor, proportional to the risk involved.
- The floor can move: if public finances deteriorate, the government pays more to borrow and drags up the cost of all credit.
- When rates rise, asset prices tend to adjust downward: the relationship is inverse.
- The market reacts to the gap between the number and the consensus, and indexes summarize the weather better than a single asset.
When a central bank raises or cuts its interest rate, what moves in theory is the cost of credit. But the news talks about something else: stocks fall, currencies shift, bond prices change. The question for anyone starting out is natural: what does a rate have to do with the price of an asset?
The answer is one of the most useful ideas for understanding markets from scratch.
The interest rate is the yardstick for minimum return: when it rises, every asset has to compensate more, and that is why prices adjust.
What does a rate have to do with the price of a stock?
Every financial asset promises, or is expected to generate, a return. And every investor has a minimum return in mind for taking on risk. That bar is not set by each person: to a large extent it is set by the interest rate.
That is why the bond, currency and stock markets all move when a monetary policy decision moves. Even if they seem like separate worlds, they share the same reference.
The policy rate is the floor
The policy rate is the rate at which the central bank lends funds to the financial system. It is the most basic interaction between banks, the loan from one day to the next, and for that reason it is the lowest rate in the economy. It sits very close to the yield on the shortest-term government bonds, and it is taken as the reference for the risk-free rate.
When public finances are sound, that short government rate works as the floor under all debt: a company or a person must pay more than it to borrow, because they carry more risk. Since it is the starting point of credit in the economy, it serves as the base for pricing every other asset.
Every asset demands a premium over that floor
Think of a high-jump competition where the judges raise the bar: some athletes are out because they can no longer clear it. Assets work similarly. Starting from the base rate, each asset demands a risk premium proportional to how risky it is.
An example with invented numbers: if the policy rate is 3% and a bond offers 10%, the compensation over the floor is 7 points. If a stock were expected to deliver only 8%, the compensation would be 5 points, lower, for taking more risk. That comparison is what leads to a re-pricing when the bar moves.
When the floor itself moves
The floor is not fixed. If a government's finances deteriorate and there is no clear source to fund spending, the government has to pay more to borrow. Its bonds yield more, the floor rises and it drags up the cost of all credit in that economy: companies, mortgages, consumption.
Expectations about monetary policy also adjust with every release. It is not enough to know today's rate: what matters is where it is expected to go and how each new number changes that expectation. That is why markets follow three fronts closely, inflation, growth and unemployment, and why the economic calendar exists.
When rates rise, prices fall
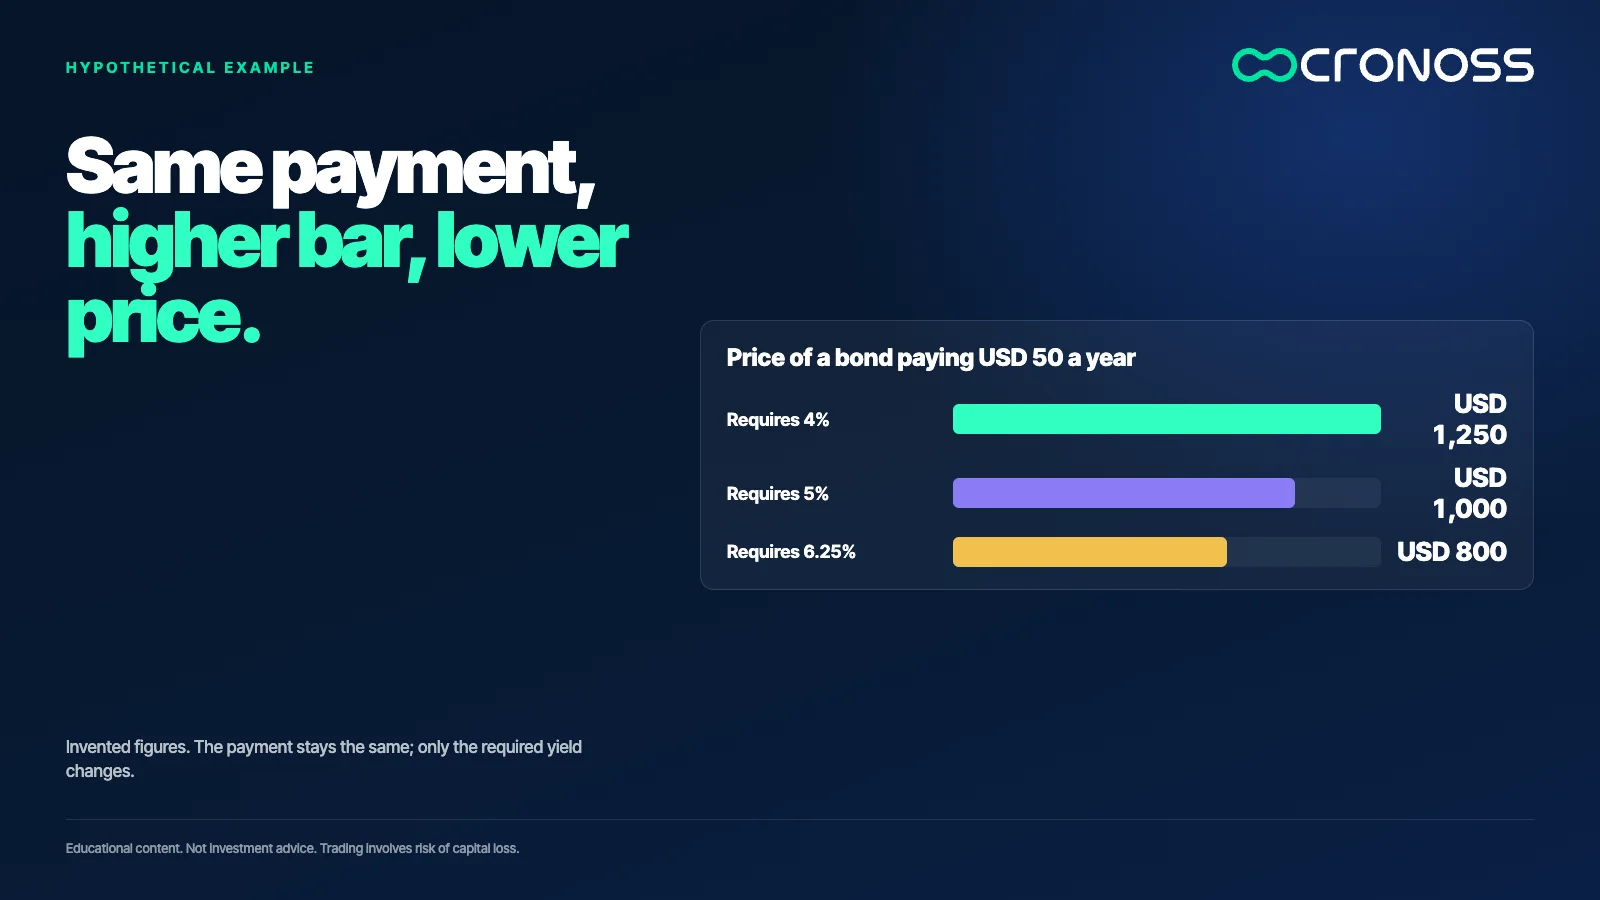
The relationship is inverse. A simplification makes it visible: a bond that pays USD 50 a year indefinitely is worth USD 1,000 if the required yield is 5% (50 ÷ 0.05). If the required yield rises to 6.25%, the same cash flow is worth USD 800 (50 ÷ 0.0625). If it falls to 4%, it is worth USD 1,250 (50 ÷ 0.04).
The cash flow did not change. The bar did. Real bonds have maturities and terms of their own, so their moves are less extreme, but the direction is the same.
The market reacts to the surprise, not the number
Navigating without indicators is like driving in fog. Some data, such as growth, comes with a lag, and investors cannot wait that long. That is why inflation, employment and activity indicators are followed; they also influence central bank decisions. Its mandate includes price stability and maximum employment, so data on both fronts is watched closely.
Analysts estimate each release and from that comes a consensus: what the market expects. If the number matches the consensus, the price barely moves, because everyone expected it. If it differs, there is a surprise, and that gap is what creates volatility.
Indexes are the market's weather
A single asset does not say how the market is doing, just as one price does not say how the fruit market is doing. That is what indexes are for, baskets that summarize aggregate behavior:
- S&P 500: the 500 largest US companies by market capitalization.
- Nasdaq: the main technology stocks.
- Dow Jones: established industrial companies.
- Russell: small-capitalization companies.
- VIX: it does not measure whether prices rise or fall, but how much uncertainty there is.
There are equivalents in other countries, such as Germany's DAX, France's CAC 40 or Spain's IBEX.
What to check before interpreting a headline
- Identify the reference rate. Ask what level it is at and in which direction it is expected to go.
- Compare the number with the consensus. A number alone says nothing: what matters is how far it is from what was expected.
- Look at the index, not one asset. Check how the basket behaves before drawing conclusions.
None of this predicts what a market will do tomorrow. It is a method for understanding why things move the way they do, and every market carries a risk of loss.
Understanding the floor changes how you read everything else
Someone who knows the relationship between rates and prices stops seeing headlines as isolated events. They start to see them as variations of one yardstick.
If the bar moves, everything measured against it moves.
If you want to continue with this map, from market participants to your first coherent order, take a look at the program Introducción Práctica a los Mercados Financieros (Practical Introduction to Financial Markets): Introducción Práctica a los Mercados Financieros.
Educational content. Cronoss is not a broker, investment firm or financial adviser, and nothing above is an investment recommendation.
Frequently asked questions
Why do interest rates affect the price of stocks and bonds?
Because the reference rate sets the minimum return demanded from any asset. If it rises, assets must compensate more and their prices adjust. That is why different markets react to the same central bank decision.
What is the risk-free rate and why is it called a floor?
It is the reference rate at which lending carries the least risk, very close to the yield on short-term government bonds when public finances are sound. It is called a floor because the rest of the debt must pay more than it.
What is the market consensus and why does it matter?
It is what analysts expect an economic release to show. Prices usually react to the gap between the actual number and the consensus, because that surprise changes expectations.
What are stock market indexes for?
They summarize the behavior of a basket of assets and show the market's weather. Examples are the S&P 500, Nasdaq, Dow Jones, Russell and the VIX, which measures uncertainty.