Key takeaways
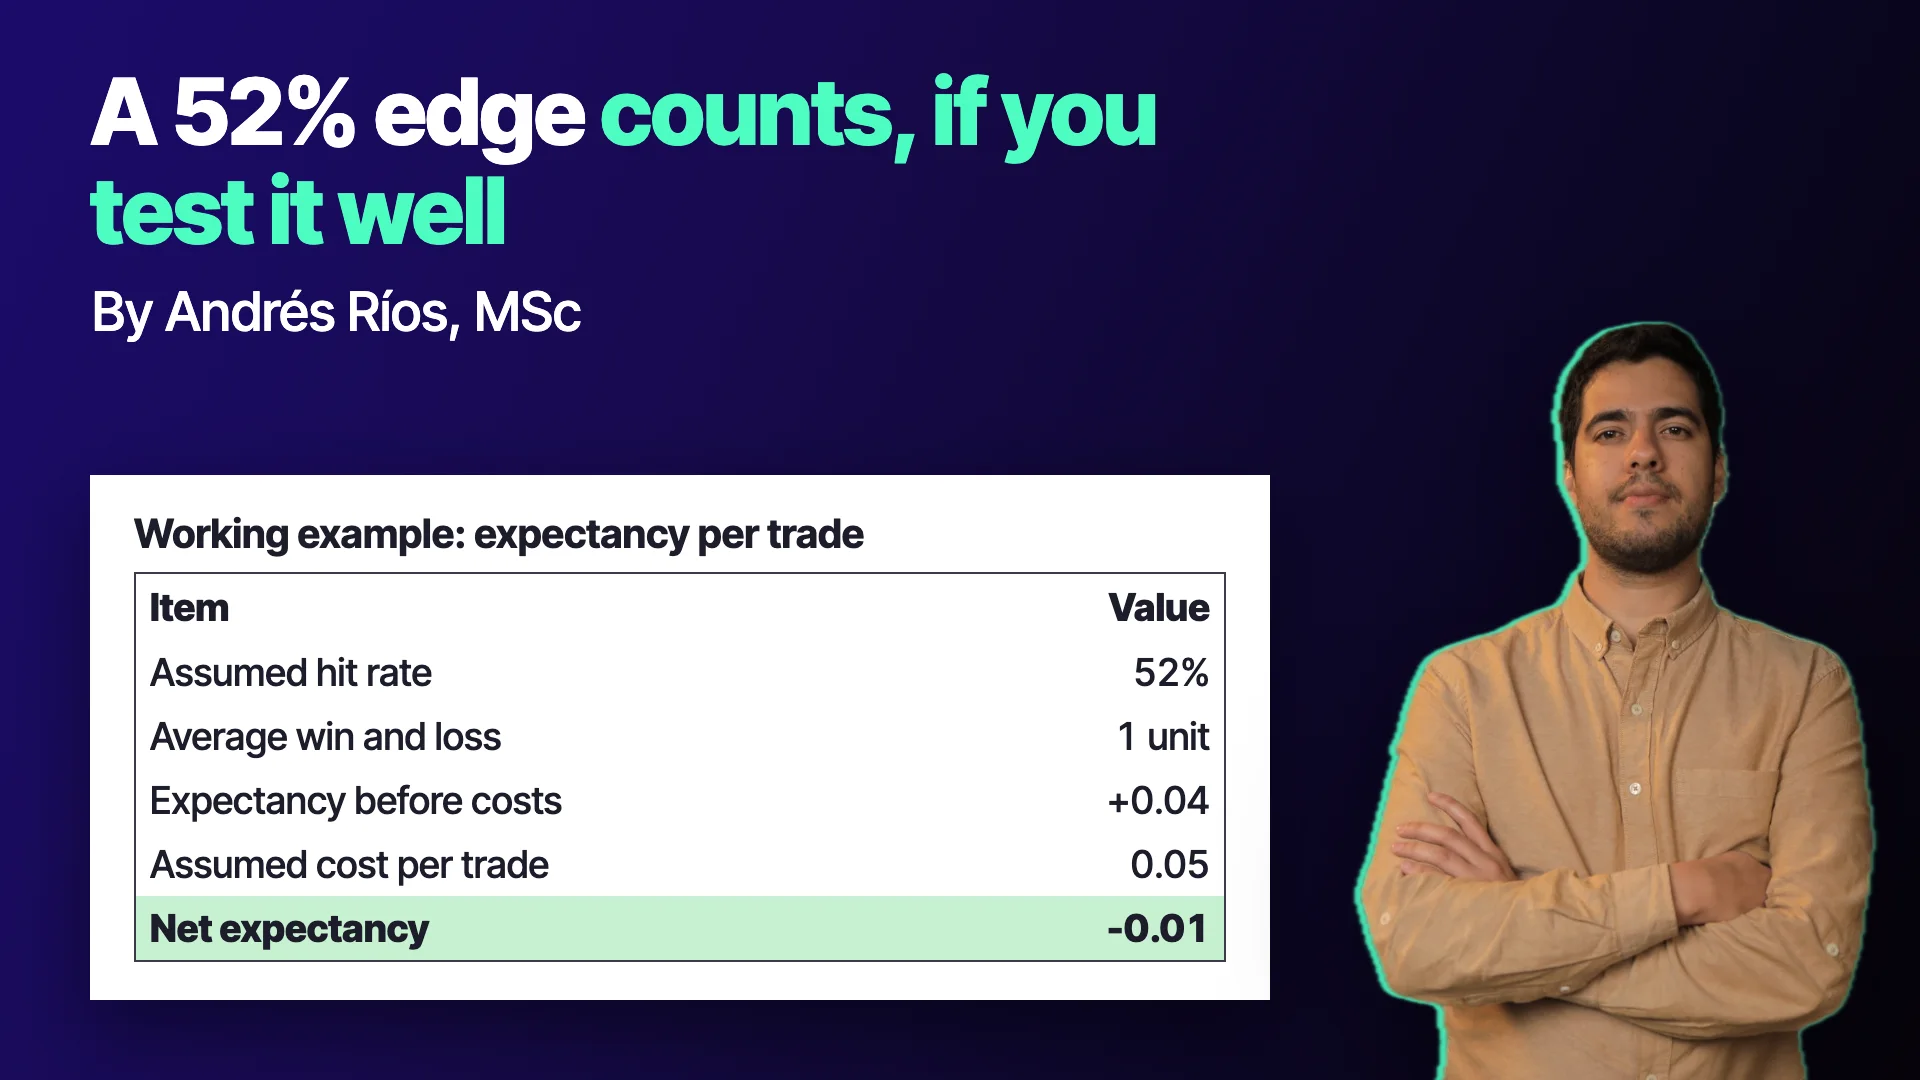
- With a 52% hit rate and equal wins and losses, a cost of 0.05 per trade turns a +0.04 expectancy negative.
- The standard error of a hit rate is about 0.5 over the square root of the trade count, so telling 52% from 50% takes about 2,500 trades.
- Every added filter is a decision made while looking at data and must be validated on a period not used to choose it.
- Exploring a rule across many assets avoids dropping it too early, but also multiplies the tests and raises the evidence you should demand.
- Starting from the minimal version of a pattern and checking trades on the chart prevents hidden logic errors.
Imagine you buy an asset any day and sell it the next one, and repeat that many times. If the market were a coin toss, you would win half the time. But what if you win 52%? It looks like an insignificant difference. In practice it can be the start of an edge, or it can be noise that disappears once costs are added.
The answer is not found by looking at a pretty curve. It is found with arithmetic and a well-posed test. A small bias is worth something only if it is larger than the noise in the sample and larger than the cost of exploiting it.
The starting hypothesis: if the market were random
One class recalled how Larry Williams began studying the stock market. His starting point was a common-sense question: if prices were random, a daily close should rise half the time and fall the other half. The exercise to check it is simple: buy with no pattern, sell the next day and count how many trades end positive.
In class it was presented that the result deviated slightly from 50%, toward the upside. That figure comes from a class demonstration and not from a published source, so here we treat it as a working example: suppose a hit rate of 52%. The explanation given for the bias is qualitative: the index analyzed replaces companies that no longer meet its requirements, and therefore tends to rise over time.
When a two-point edge is eaten by cost
The hit rate is only half the story. What matters is the expectancy per trade: probability of winning times the average win, minus probability of losing times the average loss.
Working example, with assumed figures: a 52% hit rate, average win and average loss both equal to 1 unit. The expectancy is 0.52 x 1 minus 0.48 x 1, that is, +0.04 units per trade. Now suppose each trade costs 0.05 units in commission and spread. Net expectancy becomes -0.01. A two-point edge in the hit rate that looked real ends up in negative territory.
The lesson is that a bias must always be compared with the cost of capturing it. That is why the tests in class were repeated with commissions included.
How many trades it takes to tell 52% from 50%
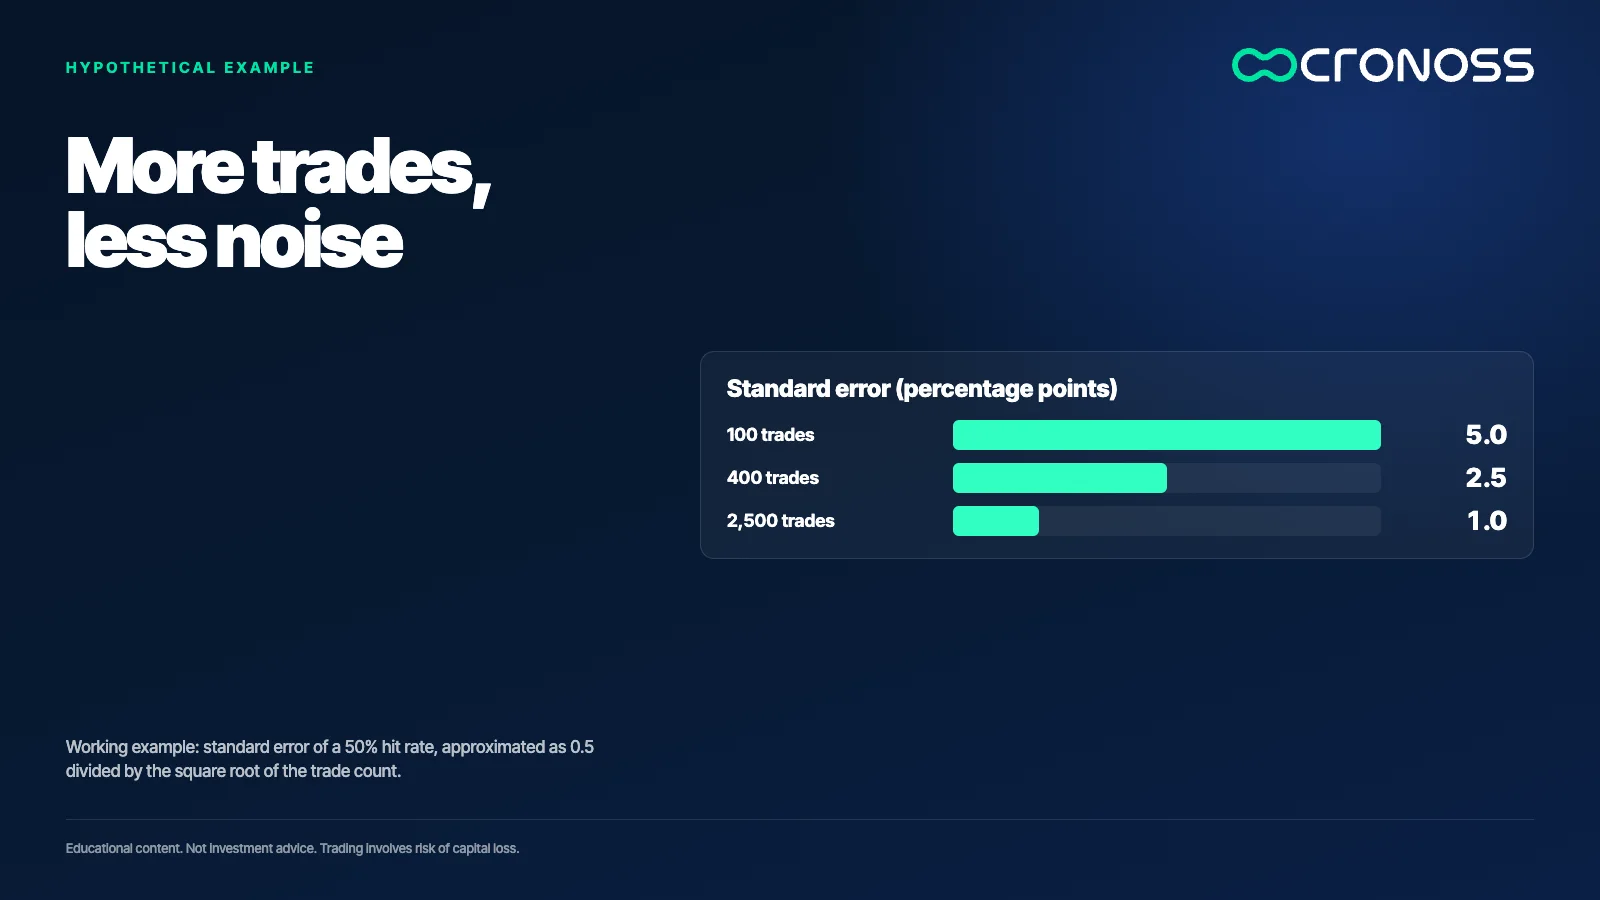
Here the second problem appears: noise. With few trades, a 52% rate is indistinguishable from a 50% one by pure chance. The standard error of a hit rate is roughly 0.5 divided by the square root of the number of trades.
Working example: with 100 trades the standard error is 5.0 percentage points; with 400, 2.5 points; with 2,500, 1.0 point. For a two-point difference to exceed two standard errors, you need about 2,500 trades. A strategy that generates 40 trades a year would take more than half a century to accumulate them.
This arithmetic explains why a short streak proves nothing and why results from a few dozen trades should be held at arm's length.
How a bias is refined: filters and their risk
Following the class, Williams tested refinements on the base rule of buying and exiting the next day. The first was entering only after a red candle, which kept the hit rate similar but raised the average profit per trade and cut the number of trades. The second was requiring three red candles in a row. The third was adding a trend filter: the current price must be above the price from a month earlier. The fourth was to stop trading on the days of the week when the rule lost the most.
Each step has logic, and each adds a decision made while looking at data. That the last filter works on strategy statistics rather than as a trigger makes it debatable, not harmless. The safety test is always the same: validate on data that was not used to choose the filter.
A second case: a two-candle pattern in other markets
A later class explored the same spirit on currency pairs. The two-candle daily pattern is minimal: the previous candle closes below the low of the candle before it, regardless of color, and a buy stop order is placed at the previous candle's high. The exit combines closing on the first day with a profit and a ten-candle limit. The short side is the mirror image.
On the first pair tested, the curve hovered near zero, with no clear edge. Several other pairs did the same. On one of them a curve appeared with 337 trades, far more interesting. The instructor drew a conclusion: had he discarded the pattern after the first pair, he would never have found that case, so it pays to explore a wide range of assets before dropping an idea.
The care that exploring many assets demands
That conclusion has a flip side worth saying out loud. Testing the same rule on many assets is another way of running many tests on one dataset. If you test ten pairs and one works, there is a considerable chance it is the product of luck.
This is what the literature calls the multiple testing problem: Harvey, Liu and Zhu studied it in finance, arguing that significance thresholds must be tightened when a lot has been tried before something is found. The pair with 337 trades is a good starting point, not a conclusion. The next step is to validate on a reserved period and look for an economic reason why that pair behaves differently.
Method lessons from the class
- Start with the minimal version. A candle-color filter was tried on the two-candle pattern and did not help; the simplest pattern worked best.
- Check the trades on the chart. Doing so uncovered a logic error in the exit, which had been coded backwards.
- Look at the adverse excursion. Exiting as soon as there is a profit smooths the curve but hides floating losses that can be huge.
- Be careful with time exits. A ten-day exit exposes the position to extreme days, which is especially delicate in stocks.
A four-step test
- Compute the expectancy per trade with costs. If the edge disappears once they are included, there is no strategy.
- Estimate how many trades you need. With the standard error, not with intuition.
- Count how many variants and assets you tried. Each one raises the evidence you should demand.
- Reserve a period you have not seen. It is the only way not to fool yourself with what you have already looked at.
Small is not the same as irrelevant
A two-point bias can be the origin of a real strategy, but only if it is measured honestly. The question is not whether the pattern looks good, but how much of what you see survives cost, sample size and the number of times you tried.
A small edge deserves a big test: more trades, costs included and data you have not touched.
To learn to measure whether a statistical edge is real, the program Métricas de Performance y Evaluación de Estrategias de Trading (Performance Metrics and Evaluation of Trading Strategies) works through these tests step by step: see the program.
Educational content. Cronoss is not a broker, investment firm or financial adviser, and nothing above is an investment recommendation.
Frequently asked questions
Is a 52% hit rate an edge?
It depends on cost and sample size. In a working example with equal wins and losses, expectancy is +0.04 per trade, but a cost of 0.05 turns it negative.
How many trades do I need to tell 52% from 50%?
About 2,500. The standard error of the hit rate is roughly 0.5 divided by the square root of the trade count, and at 2,500 it is 1.0 percentage point.
Why can exploring many assets be a problem?
Because each asset is another test on the data. If you test ten and one works, there is a considerable chance it is luck, so you need to validate on a reserved period.
Why start from the simplest version of a pattern?
Because every extra condition shrinks the sample and adds a decision. In class, a candle-color filter did not improve a two-candle pattern that already worked using only price levels.


