Key takeaways
- A naked close happens when a second red candle closes below the first one's low, and the hypothesis is that the breakout may be bait.
- A condition that depends on the current candle's close cannot be evaluated live; you must shift the pattern or use a stop order.
- The stop order at the previous high acts as a natural filter and removes one condition from the rule.
- In a class test the confirmation version produced only 85 trades, too few to cover the strategy's degrees of freedom.
- Testing each side separately, reserving unseen data and not mixing filtered versions avoids fooling yourself with the result.
A price falls two days in a row and the second one closes below the first one's low. For many traders that is a downside breakout and an invitation to sell. Larry Williams proposed looking at it the other way around: perhaps that breakout is bait for those who go short, and what follows is a rebound.
It is a bold hypothesis, and that is exactly why it deserves a demanding test. An extreme close is neither a buy nor a sell signal: it is a condition that can be described with prices, counted and put through a test that can fail.
What is a naked close?
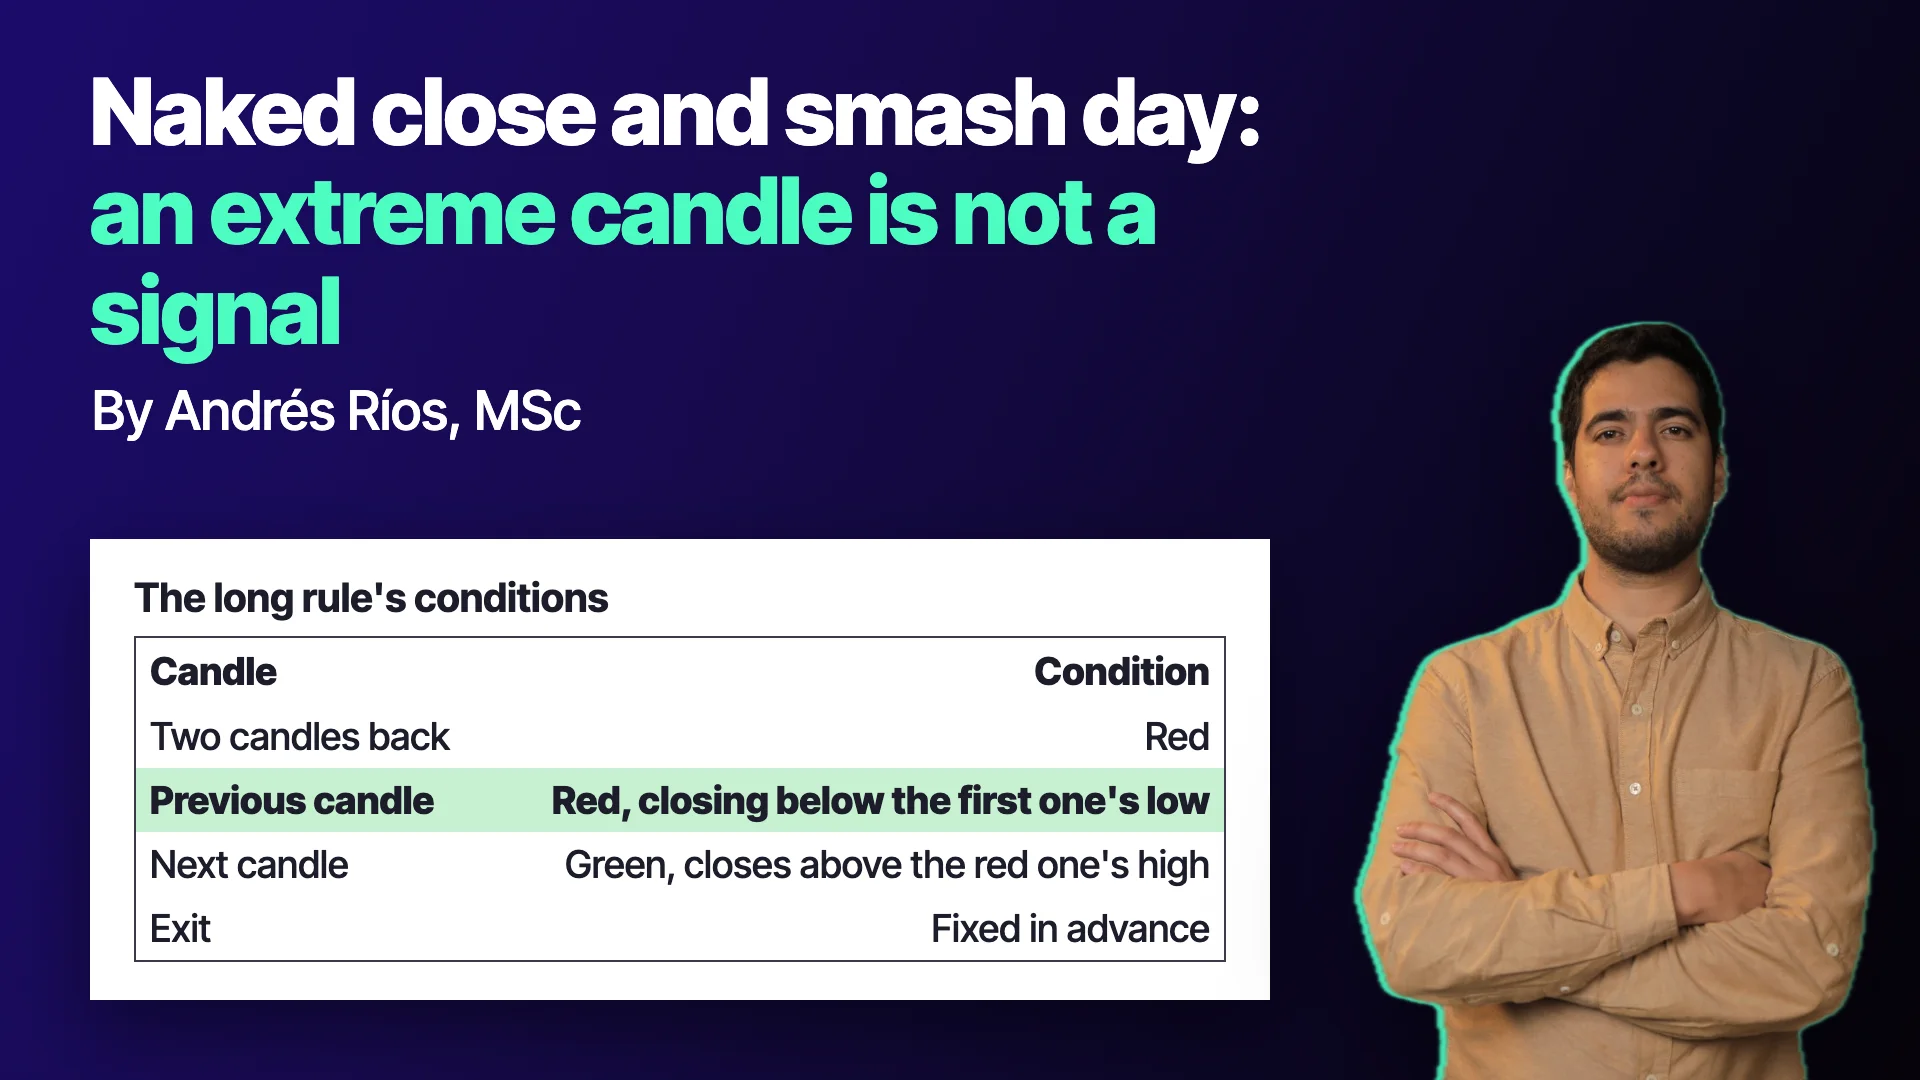
The long version of the pattern, which Williams calls the naked close, has three elements. There are two red candles in a row. The second closes below the low of the first. And the next candle is green and closes above the high of the previous red candle.
The second red candle has a naked close because it is not supported by any prior low: price fell below the immediate support and closed there. That is usually read as a breakout. The pattern does not go short on it; it waits for the next candle to disprove it and goes long, at market, on the open of the candle after that. The original exit is simple: close on the following day.
The pattern has a mirror image for the short side, with the conditions inverted.
The smash day: the simplified version
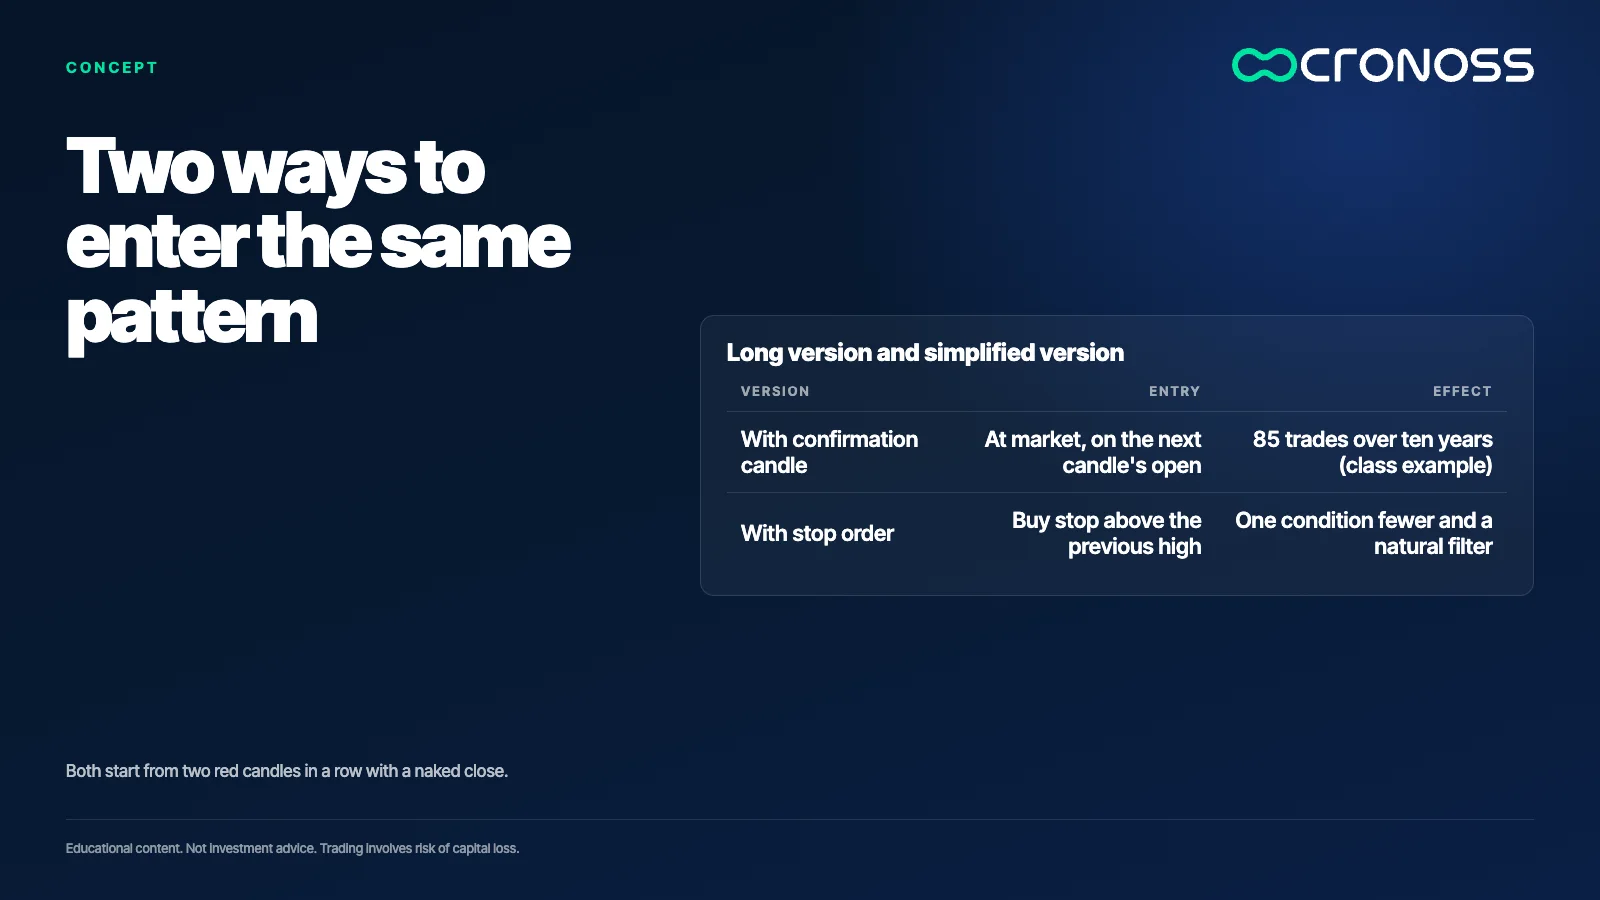
The class presented a shorter variant, which Williams also describes and which comes close to what he calls a smash day. It keeps the essential part: two red candles in a row, the second with a naked close. Instead of waiting for a green confirmation candle, it leaves a buy stop order at the previous candle's high and waits for price to trigger it.
That stop order serves two functions. It is a natural filter: if price keeps falling and never reclaims that high, there is no trade. And it removes one condition from the rule, which makes the pattern more likely to occur and leaves more signals to study.
The logic behind it: the bait
Williams' explanation is behavioral. A breakout below a low draws attention, and many people go short convinced the fall will continue. If there are pressures holding price up at that point, the breakout fails, the shorts get trapped and the move reverses.
It is best read as a hypothesis. The instructor presented it with another useful fact: the pattern was described for commodities and worked better on assets with an upward bias. On assets that move in a range or have a downward bias, it does not work the same. A pattern like this depends on the asset where it is tested.
The first obstacle: a condition that cannot be evaluated
Coding the long version reveals a practical problem. The last condition asks for the current candle to be green and close above the previous high, but that candle has not finished yet. Its close is unknown, and a rule cannot evaluate something that does not exist.
There are two fixes. The first is to shift the whole pattern back one candle: you evaluate the already closed candle and enter on the next open. The second is to drop that condition and use the stop order. The difference matters more than it seems, because the second version removes a degree of freedom.
What the class tests showed
With the first fix, on a stock index and ten years of history, the rule generated only 85 trades across longs and shorts. It is a class example. With so few trades and so many conditions and parameters, such as the 10-candle exit for longs and 2 for shorts, the sample does not cover the strategy's degrees of freedom.
With the simplified version, longs only and a five-day exit, the rule produced 181 trades, with no parameter to optimize: there are no indicators and the conditions are tied to the exact position of each candle. When the stop order at the previous high was added, the number of trades dropped, because the order acts as a filter. Shorts, on the other hand, lost money on the index, which has an upward bias, and were discarded.
Other exits were also tested. An exit that closes as soon as there is a profit made the maximum drawdown worse on a first attempt. An exit using a two-period RSI reduced the depth of that drawdown, although it did not remove the flat stretch of the curve. On another similar index the result was weaker, which suggests that the edge, if it exists, is not robust across all assets.
Practices the class taught
- Do not burn the whole history. Running the test on ten years at once and then tuning the rule is a form of implicit optimization, because you have already seen the full result.
- Do not mix versions. If you add a filter on one asset, its trades are no longer comparable to those of the unfiltered version, and they should not be pooled in one analysis.
- Every filter has a cost. Adding conditions degrades the rule and shrinks the sample.
- Keep a realistic spread. It was even recommended to exaggerate it a little when testing.
A four-step test
- Write each condition with prices and candle offsets. And check that none depends on a data point that does not exist yet.
- Count the trades before looking at the curve. If there are only a few dozen, the sample falls short.
- Test each side separately. One side can win and the other lose, and the combined result hides it.
- Reserve data you have not seen. Validate in another period or on a similar asset, without retuning.
Bait can also be an idea
The value of these patterns is not in promising rebounds, but in showing how an idea about market behavior becomes a written rule and faces a test. The bait story is attractive. The test decides whether it deserves more than that.
A good-sounding explanation does not make evidence: only data, with costs and without tricks, can do that.
To learn to turn a market idea into a testable rule, the program Análisis Técnico Avanzado de Mercados Financieros (Advanced Technical Analysis of Financial Markets) works through these cases step by step: see the program.
Educational content. Cronoss is not a broker, investment firm or financial adviser, and nothing above is an investment recommendation.
Frequently asked questions
What is a naked close?
It is a candle whose close lands below the previous candle's low, with no prior low supporting it. In Williams' pattern it occurs on a second red candle and is read as possible bait for those who sell the breakout.
What is the difference between the naked close and the smash day?
The long version waits for a green confirmation candle above the previous high. The simplified version drops that candle and leaves a buy stop order at the prior candle's high, with one condition fewer.
Why were shorts discarded in the class test?
Because the tested index has an upward bias and shorts lost money. Testing each side separately prevents one side's result from hiding the other's loss.
Why not test the full ten years at once and then adjust?
Because once you see the full result and fix the rule, you are doing implicit optimization on that same data. Reserving an unseen period lets you validate properly.


