Key takeaways
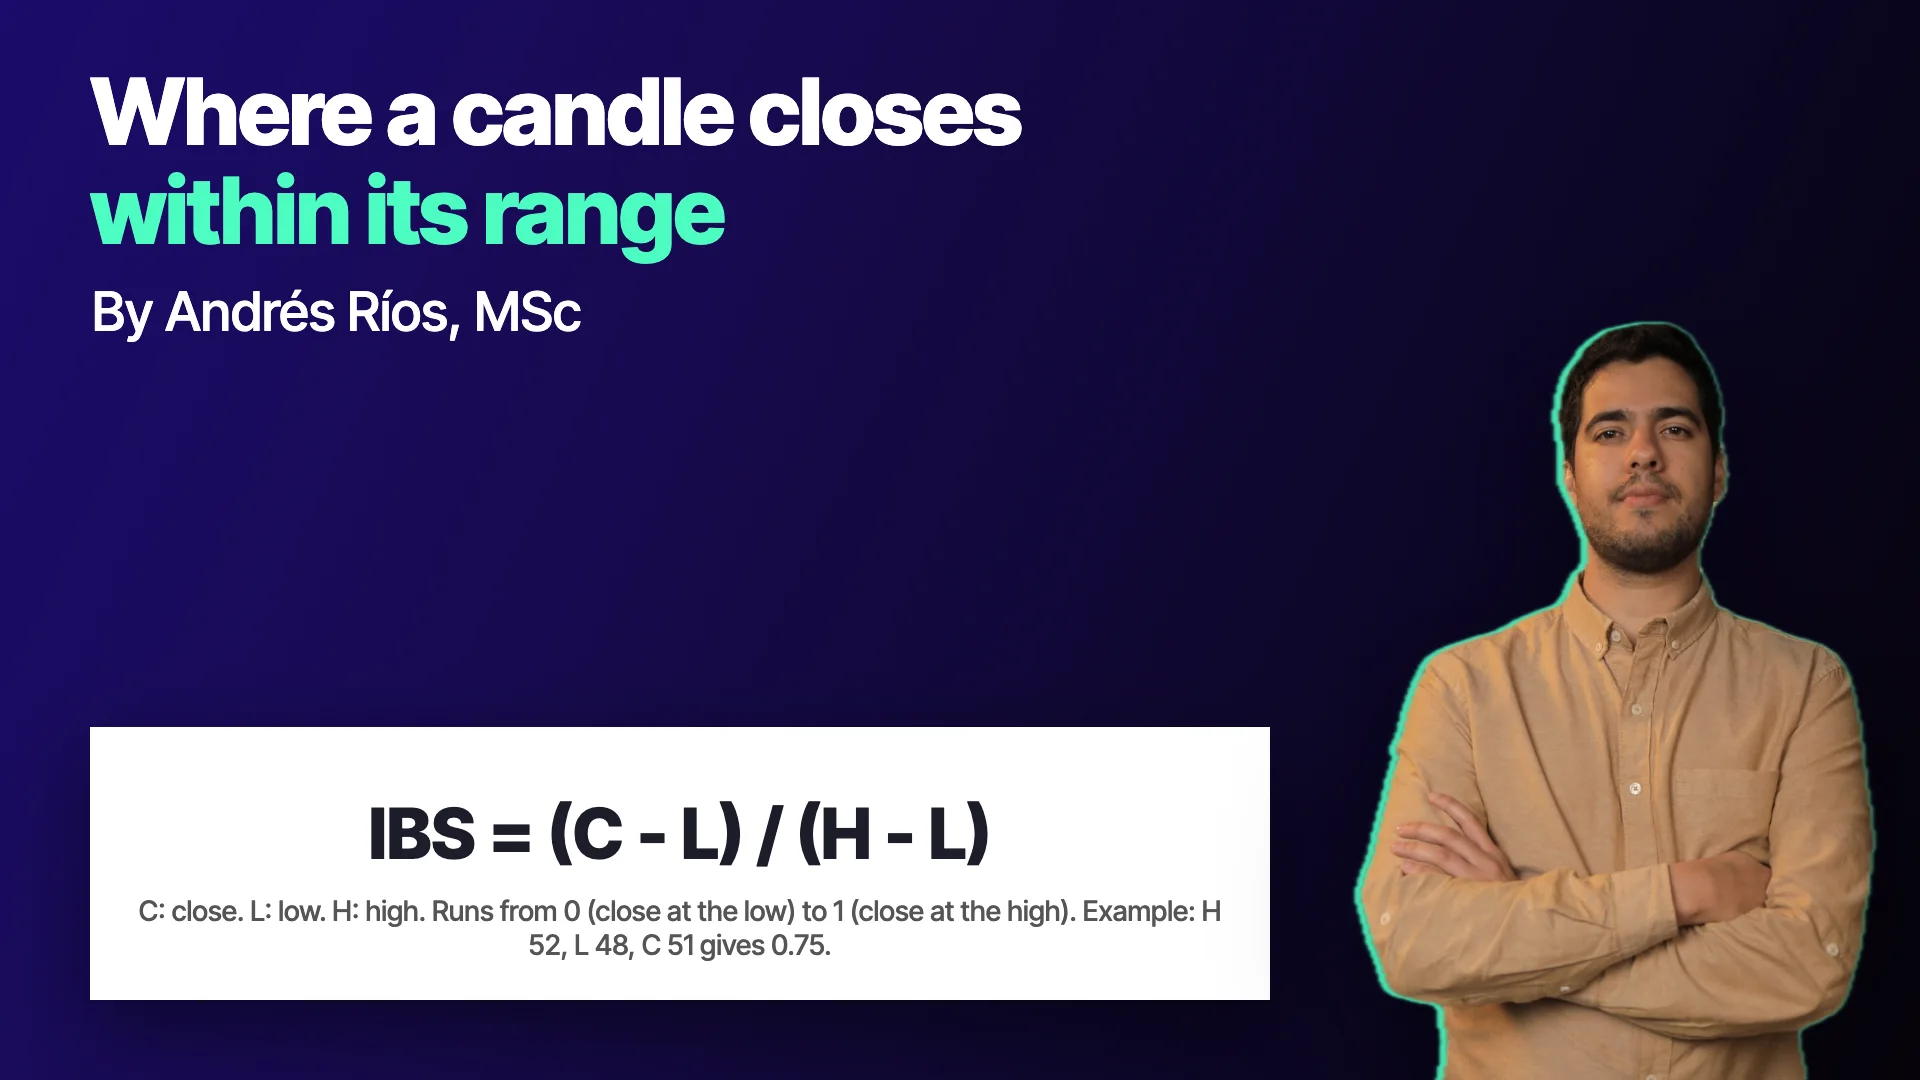
- IBS is (close - low) / (high - low) and runs from 0 to 1, placing the close within its own candle's range.
- Describing candles as percentages of the range makes the rule adapt to the size of each candle.
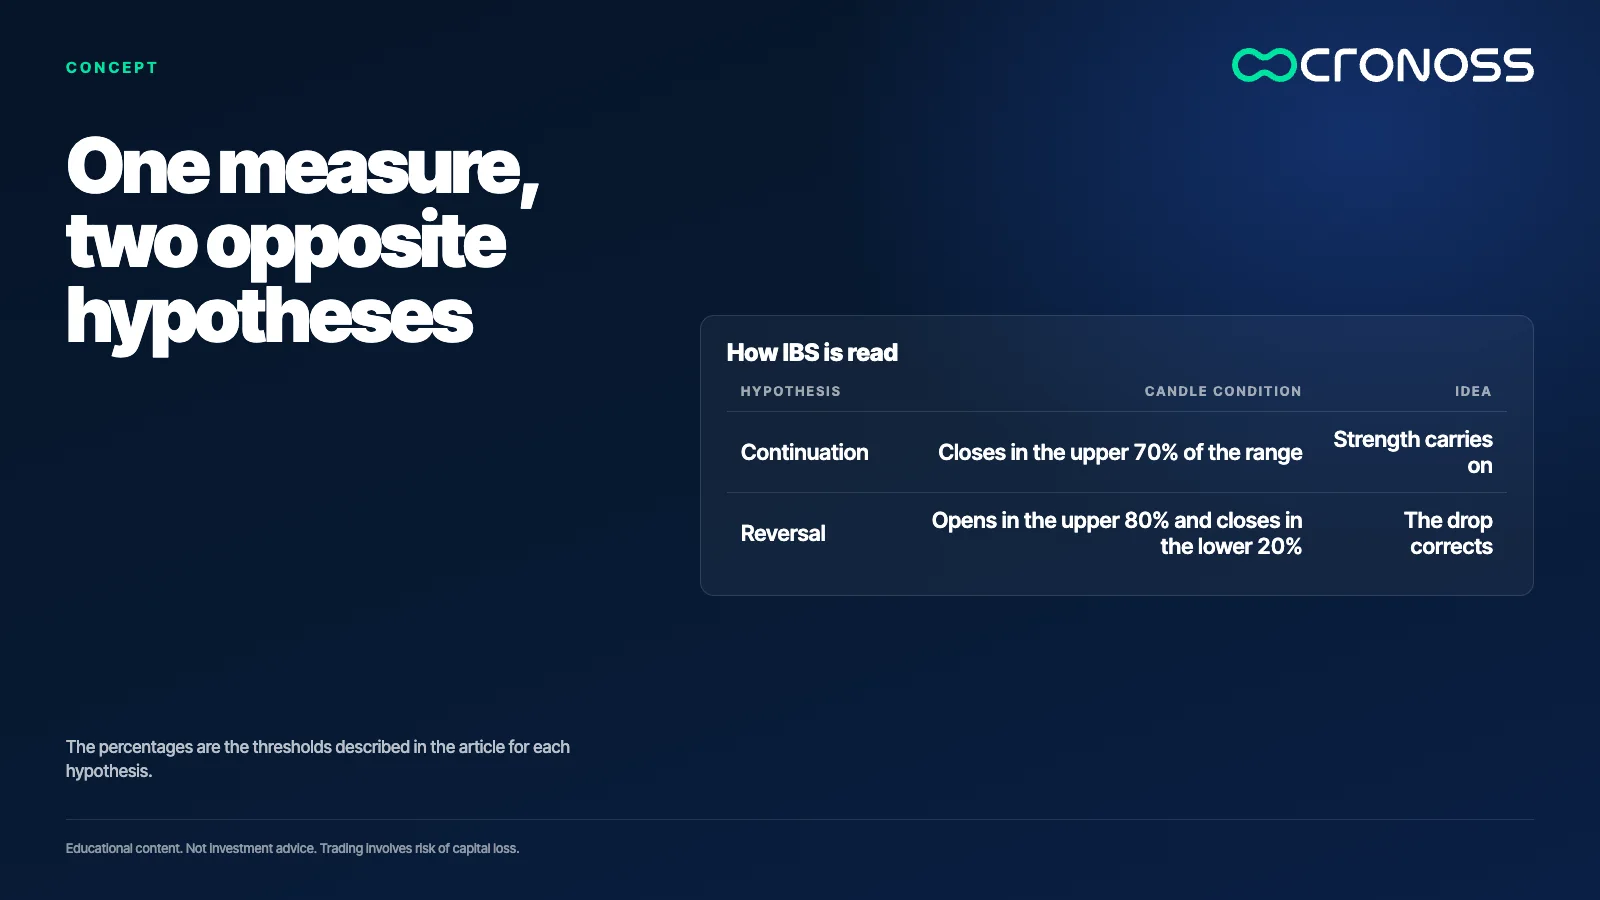
- The same measure serves two opposite hypotheses: a high close as continuation or a very low close as reversal.
- In a class test, replacing the inverse-pattern exit with a fixed-days exit improved the curve of the continuation pattern.
- A rule with an upward bias must be compared with the underlying asset, since it can be highly correlated with it.
Two daily candles can have the same range and tell opposite stories. In one, price closes pinned to the day's high. In the other, it closes pinned to the low. A very simple measure, which places the close within its own candle's range, describes that difference with a single number.
That measure is known as internal bar strength (IBS). What is interesting is that, depending on who uses it, it supports opposite hypotheses: some read it as a sign the move will continue and others as a sign it will reverse. IBS does not say what price will do: it only describes where it closed, and every hypothesis built on top of it must pass its own test.
What does IBS measure, and how is it calculated?
The calculation uses a single candle: high, low and close. The low is subtracted from the close and the result is divided by the candle's full range.
IBS = (close - low) / (high - low)
The result runs from 0 to 1. A close at the low gives 0, one at the high gives 1, and one halfway gives 0.5. It is a one-candle oscillator, as opposed to one that looks at several periods like the Williams %R, and that is why it can be used as a percentage of the range: the rule adapts on its own to the size of each candle.
It can also be calculated with the open instead of the close, to know where in the range the candle started.
An example with numbers
This is an illustrative example with made-up figures. A candle has a high of 52, a low of 48 and a close of 51. The range is 4. The close is 3 units above the low, so the IBS is 3 / 4 = 0.75.
With that number you can write the shape of a candle in a few conditions. For example, a candle with a strong bullish body can be described as one that opens in the lower 20% of the range and closes in the upper 20%. A red candle with a very low close, as one that opens in the upper 80% and closes in the lower 20%. Instead of describing candles with adjectives, you describe them with percentages.
First hypothesis: continuation
One of the uses seen in class attributes to Larry Williams an idea he presented almost as a law of the market: if a daily candle closes in the upper 70% of its range, price is likely to keep rising over the following days. As a trend forms, closes tend to land closer and closer to the high.
The entry rule is short: close above the low plus 0.7 times the previous candle's range. The original exit used the inverse pattern: close when a candle closed in the lower 30% of its range. That logic chases the trend without a fixed target.
This reading resembles the overbought reading of the stochastic oscillator, which rises when closes approach the high of the range. The difference is that here it is not interpreted as an excess to correct, but as a sign of strength that continues.
Second hypothesis: reversal
The opposite use was attributed by the instructor to a trader from the 1990s. Here IBS describes an extreme red candle: it opens in the upper 80% of the range and closes in the lower 20%. The hypothesis is that such a sharp fall within a single candle tends to correct. The entry is a long position at market on the next candle, and the exit comes when a candle closes above 80% of its range.
In the class demonstration, this simple rule produced about 140 trades over a ten-year history. It is a class example, not a conclusion, but it offers a sample large enough to start studying. When the entry was changed to a limit order below the prior candle's low, the result did not improve and the original entry was kept.
What happens when both are tested
In the continuation pattern test there was an instructive finding. The strategy appeared exposed almost all the time: it closed a trade and opened the next one immediately. When the trades were reviewed on the chart, it turned out the inverse-pattern exit was taking the position out too early, before the move developed. Switching to a fixed-days exit improved the curve.
A deeper risk was also pointed out: the rule only makes sense on assets with an upward bias, and then the strategy ends up highly correlated with the asset itself. To know whether it adds anything, you have to compare its maximum drawdown with that of the underlying asset, not just look at the curve. A trend-strength filter, such as ADX below 20, was mentioned as a way to avoid sideways phases.
A three-step test
- Write the candle as percentages of the range. Define how much "near the high" is before looking at results.
- Pick one hypothesis per test. Continuation or reversal, not both at once, because each needs its own exit.
- Compare against the underlying asset. A rule that only pays when the asset rises does not demonstrate an edge of its own.
One measure, two stories
IBS is a descriptive tool. It tells you where price closed and lets you define candles precisely, but it does not say why it closed there or what follows. The same high reading can feed a continuation hypothesis or, in another context, a reversal one.
Measuring a candle well is the first step; deciding what the measure means is the work of the test.
To go deeper into how candle patterns are described and tested with written rules, the program Análisis Técnico Aplicado (Applied Technical Analysis) develops them with examples: see the program.
Educational content. Cronoss is not a broker, investment firm or financial adviser, and nothing above is an investment recommendation.
Frequently asked questions
How is IBS calculated?
Subtract the candle's low from the close and divide by the full range, high minus low. The result runs from 0, a close at the low, to 1, a close at the high.
Does a high IBS mean price will rise?
Not necessarily. A high IBS can feed a continuation hypothesis, but it is also used in reversal rules in another context. Each hypothesis must be tested with its own rules, costs and sample.
How is IBS similar to the stochastic?
Both place the close within a range. IBS uses a single candle, while the stochastic uses the high and low of several periods.
Why compare the rule with the underlying asset?
Because on assets with an upward bias a continuation rule can be highly correlated with the asset itself. Comparing the maximum drawdown of both shows whether the rule adds anything of its own.


