Key takeaways
- A continuation pattern is a short pause inside a trend, not a change of direction.
- Validating a pattern takes three steps: prior trend, pattern and a breakout in the direction of that trend.
- The ascending triangle combines rising lows with a horizontal resistance, and the descending one falling highs with a horizontal support.
- The symmetrical triangle has no horizontal line: its lines converge and the prior trend hints at the breakout direction.
- The height of the base is a rough reference for the move, but risk management matters more than the pattern.
A triangle on a chart looks like a clear signal: price narrows between two lines that close in, and everything suggests something is about to happen. The doubt is what. It can be a pause inside a trend that will go on, or it can be the first step of a reversal.
Someone who draws the pattern without looking at what came before, and without waiting for the breakout, is usually reading a shape, not a market situation. A pattern without context is just geometry.
A continuation pattern is a short pause inside a prior trend, and it is only confirmed when price breaks out in the direction of that trend.
What is a continuation pattern?
Continuation patterns, also called figures or formations, are chart structures that appear when the market takes a breather inside a trend. Price rises, stalls for a while, then resumes the same path. The same happens on the way down.
They differ from reversal patterns, which suggest the trend is running out and may flip. Anyone who knows Japanese candlestick patterns will recognize the logic: there, too, some candles speak of reversal and others of continuation. The difference is that here you analyze a structure of several candles, not one or two.
Technical analysis is not an exact science. Patterns describe a reasonable probability of what may happen, not a certainty. Academic research on pattern recognition shows mixed results: some patterns add information under certain conditions, and none guarantees an outcome.
The three steps: prior trend, pattern and breakout
For a continuation pattern to make sense, three things must happen, in this order.
- Prior trend. Before the pattern there must be a clear direction, up or down. In a sideways market these patterns lose reliability, because there is nothing to continue.
- Pattern. During the pause, price moves inside a recognizable structure. Trading volume often falls in the meantime.
- Breakout. The pattern is confirmed when price leaves it with force, from buyers or from sellers. Without a breakout, there is only a shape on the chart.
The pause is short by definition. As a general reference, the structure usually forms over about 5 to 20 candles. It is not a rigid rule, but a pattern that needs hundreds of candles is no longer a breather, it is another phase of the market.
Ascending triangle: higher lows against a resistance
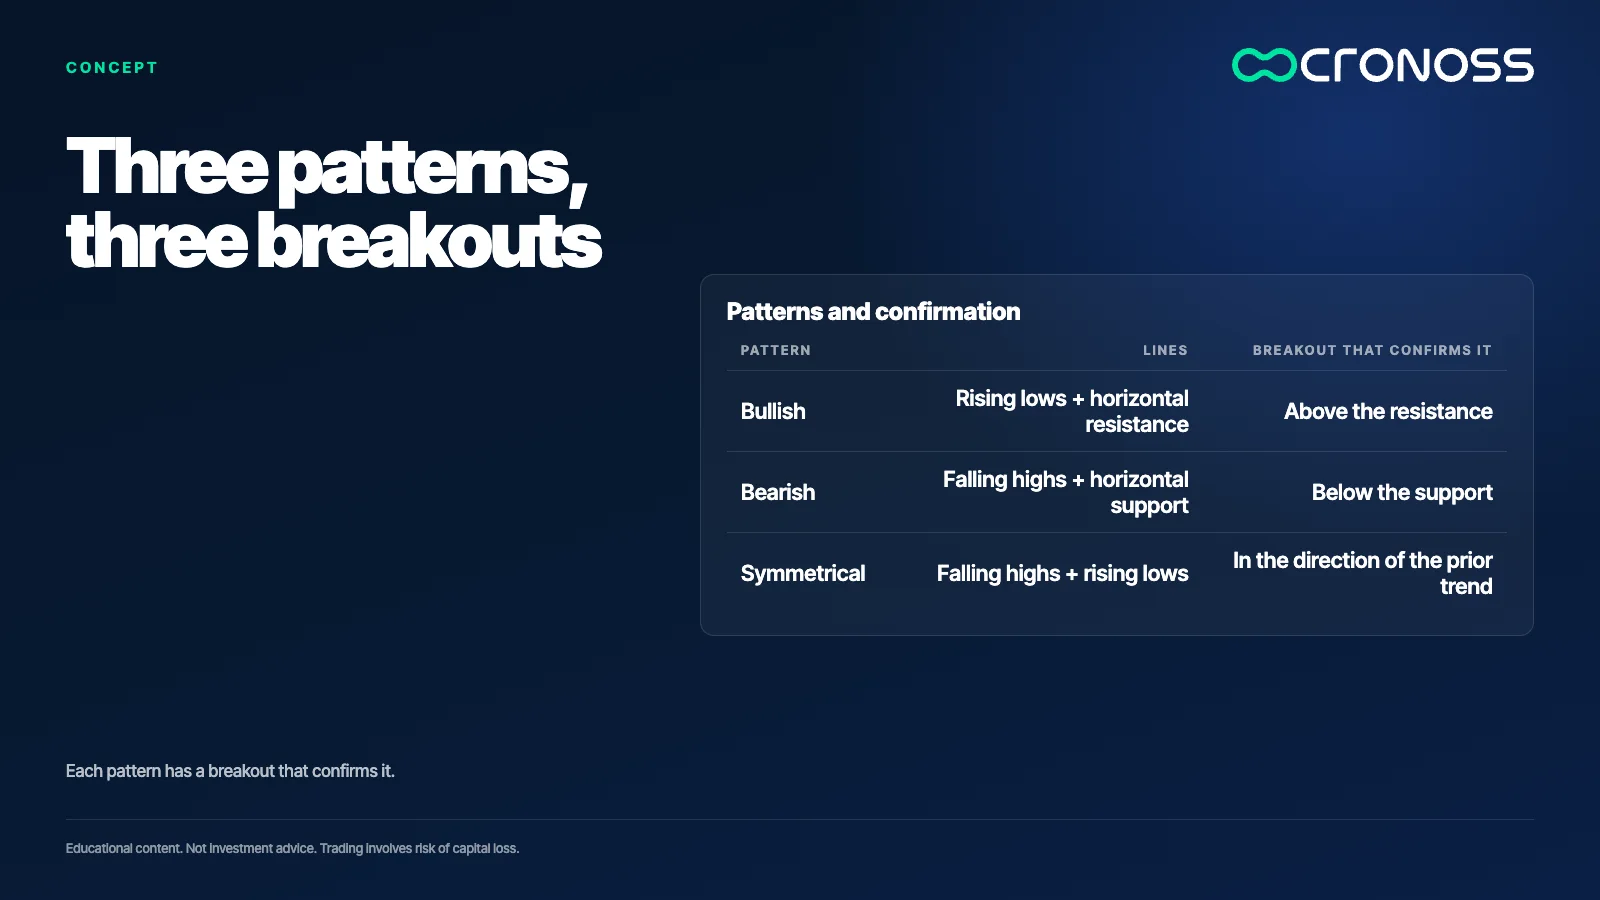
The ascending triangle combines two lines: a rising trendline joining ever higher lows, and a horizontal resistance that price fails to clear.
Each dip meets buyers sooner, and each rally hits the same ceiling. Price gets cornered. The expectation is a buying trend before the triangle and a breakout above the resistance. If volume also grows at that moment, it is read as more buying pressure.
Descending triangle: lower highs against a support
It is the mirror image. A falling trendline joins ever lower highs and a horizontal support contains the drops. Buyers give ground little by little, and price approaches the floor.
The prior trend should be down, and the breakout that confirms it comes below the support, with dominant selling pressure.
In both cases the logic is the same: in markets there are buyers who think of higher prices and sellers who think of lower prices. If patterns exist for one side, they exist for the other.
Symmetrical triangle: two converging lines
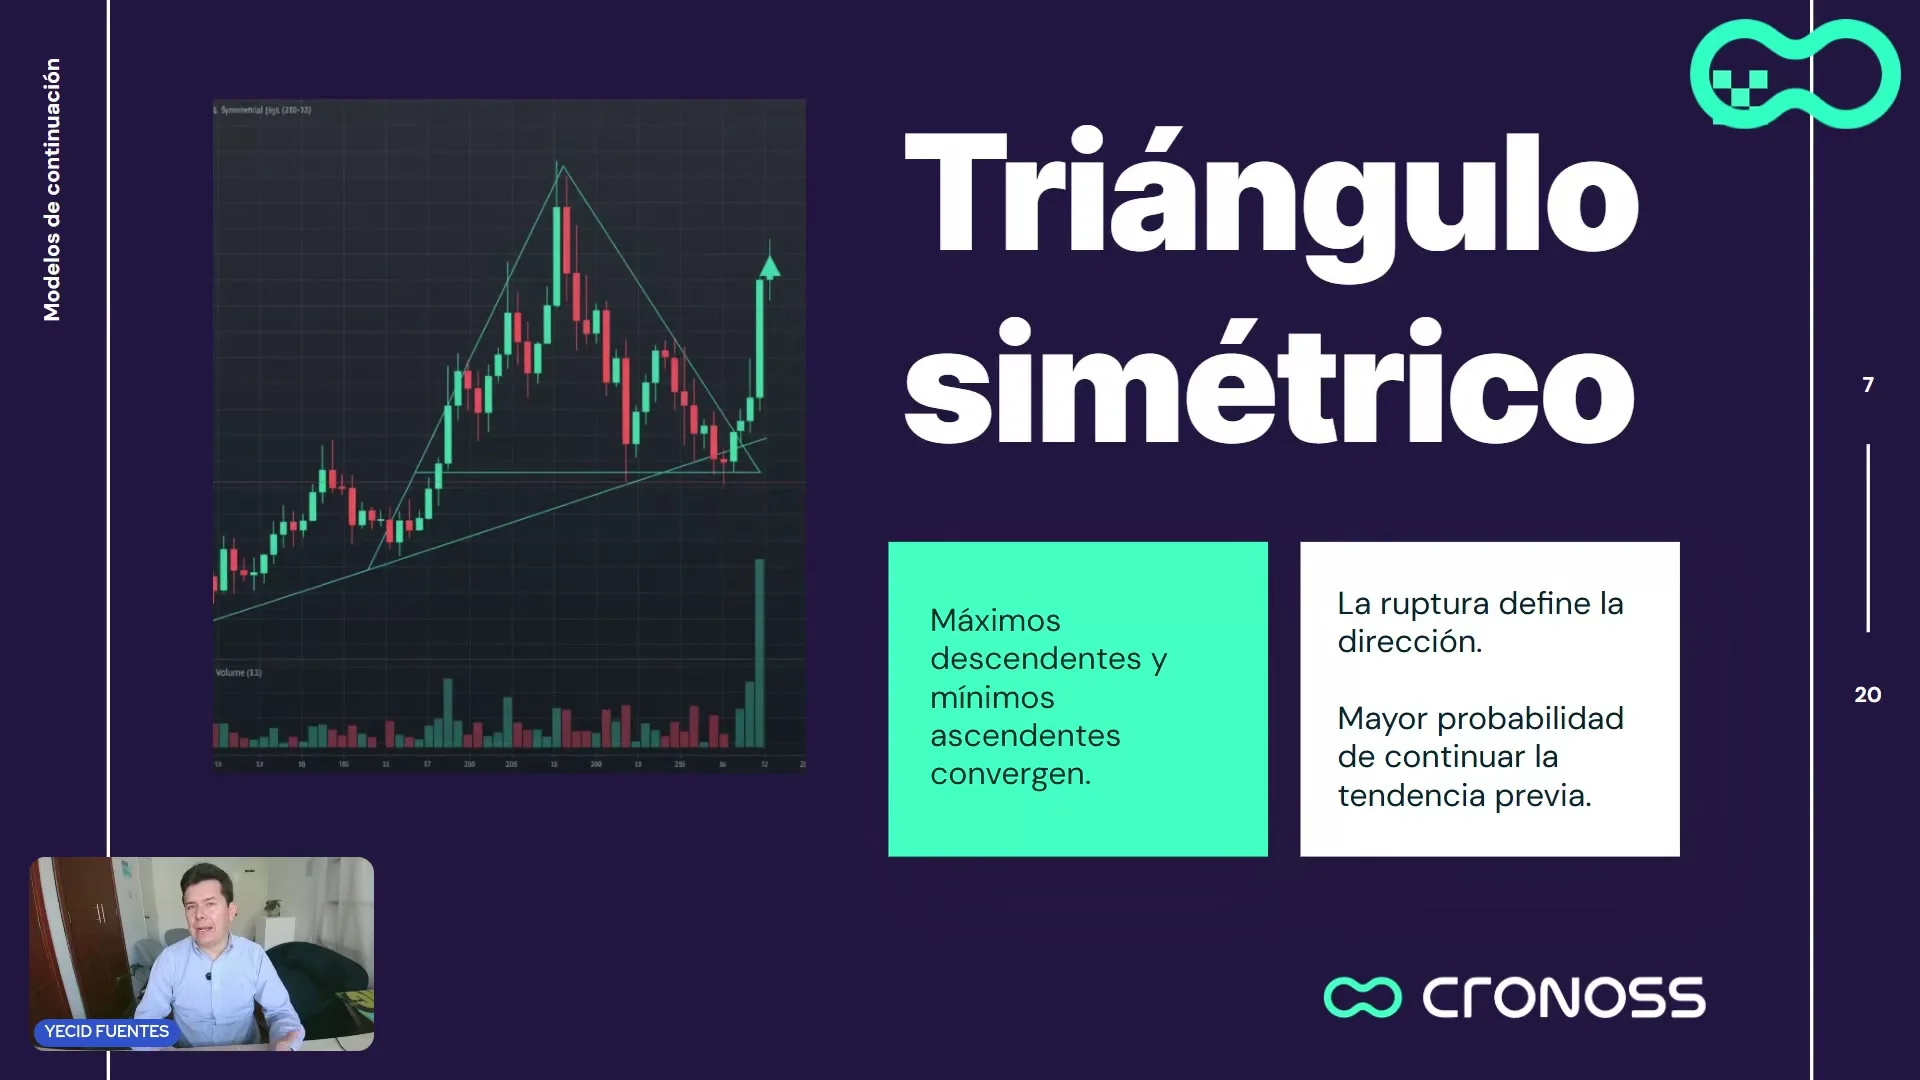
The symmetrical triangle has no horizontal line. Highs fall and lows rise at the same time, so the two lines close in. To form, it needs wide earlier swings in both directions, which is why it is less common than the other two.
With no preferred side, the prior trend gives the clue: if it was rising, an upward breakout is the expected one, and if it was falling, a downward one. Until the breakout happens, you do not know which path price will take.
How many candles and on which timeframe
A common mistake is to believe these patterns only work on minute charts. They can appear on 5-minute, hourly or daily charts. What matters more than the timeframe is the amount of data: the structure should be short relative to the trend that precedes it.
The two lines do not have to be historic either. A valid resistance can rest on three highs at the same level, and the trendline on a few lows. The two lines also do not always start at the same point: one can be older than the other.
What to do when the breakout goes the other way
Continuation patterns teach a discipline: wait for the right breakout. It can happen that a descending triangle, with a prior downtrend, breaks upward. The pattern met two of the three steps, but not the last.
Some analysts trade only breakouts in the direction of the prior trend, because those are what the definition of continuation covers, and do not act on the others. Others combine them with indicators or with their own criteria. Whatever the method, what matters is to define it beforehand and not improvise it in the moment.
The triangle base and risk management
The base is the height of the pattern at its widest point, at the start, between the trendline and the horizontal line. It is used as a rough reference for how far price might travel after the breakout.
An illustrative example: if the base measures USD 5 and the breakout is in the trend's favor, the reference move would be about USD 5. It is not a promise. It is an order of magnitude to judge whether the risk is worth taking.
That is where risk management comes in. If the level where the idea is invalidated is USD 2 from the entry and the reference move is USD 5, the ratio is 2.5 to 1. If the invalidation level is farther away than the expected move, the trade does not pay for its risk, however good the pattern looks. Recognizing patterns matters less than managing how much you risk on each one.
A checklist before treating a pattern as valid
- Was there a clear prior trend? If the market was sideways, the pattern loses meaning.
- Is the structure short, with both lines well supported? Few data points and at least two or three touches on each line.
- Did a breakout occur in the direction of the trend? Without it, the pattern has not been confirmed.
A pause is not a signal
A triangle describes how price behaved during a breather. What turns it into useful information is what came before and what happens after. The pattern alone is a shape. With a prior trend, a breakout and a clear idea of how much is at risk, it becomes a decision criterion.
If you want to learn to read these patterns step by step, with chart examples, the program Análisis Técnico Aplicado (Applied Technical Analysis) covers them in more detail.
Educational content. Cronoss is not a broker, investment firm or financial adviser, and nothing above is an investment recommendation.
Frequently asked questions
What is a continuation pattern in technical analysis?
It is a chart structure that appears as a brief pause inside a trend and suggests the trend may go on. It is confirmed when price breaks out of the pattern in the direction of the prior trend.
How do you tell an ascending triangle from a descending one?
The ascending triangle has higher and higher lows against a horizontal resistance and is expected after a buying trend. The descending one has lower and lower highs against a horizontal support and is expected after a selling trend.
How many candles should a continuation triangle have?
As a general reference, between 5 and 20 candles. It is not a rigid rule, but a structure of hundreds of candles is no longer a brief pause. The chart timeframe matters less than the amount of data.
What if price breaks out against the prior trend?
The pattern fails the third step of a continuation pattern. Some analysts do not act in that case and others combine it with other criteria, but the method should be defined before trading.