Key takeaways
- The Oops pattern requires the open to sit below yesterday's low and price to reclaim that level to trigger the entry.
- The herd-mistake explanation is a behavioral hypothesis, not a proven fact.
- A rule is born in a market environment; if sessions or microstructure change it must be tested again.
- Stricter filters, such as a minimum gap, shrink the signals until little statistical basis remains.
- Moving parameters until the curve looks good is overfitting, and a pattern's popularity can erode its edge.
An asset has been rising, a short session closes, and the next day it opens below the previous candle's low. At first glance that looks like proof the drop will continue. The Oops pattern starts from an uncomfortable question: what if that immediate reading is exactly the one that fails most often?
The idea is attributed to Larry Williams, who described it in his books on short-term trading. It makes a good case study because its logic is easy to write down and still has several points where the rule can break. The Oops pattern is not an order to buy after a bearish gap: it is a hypothesis about how price reacts when an open contradicts the trend, and it is worth only what survives a test.
What is the Oops pattern, and how is it defined?
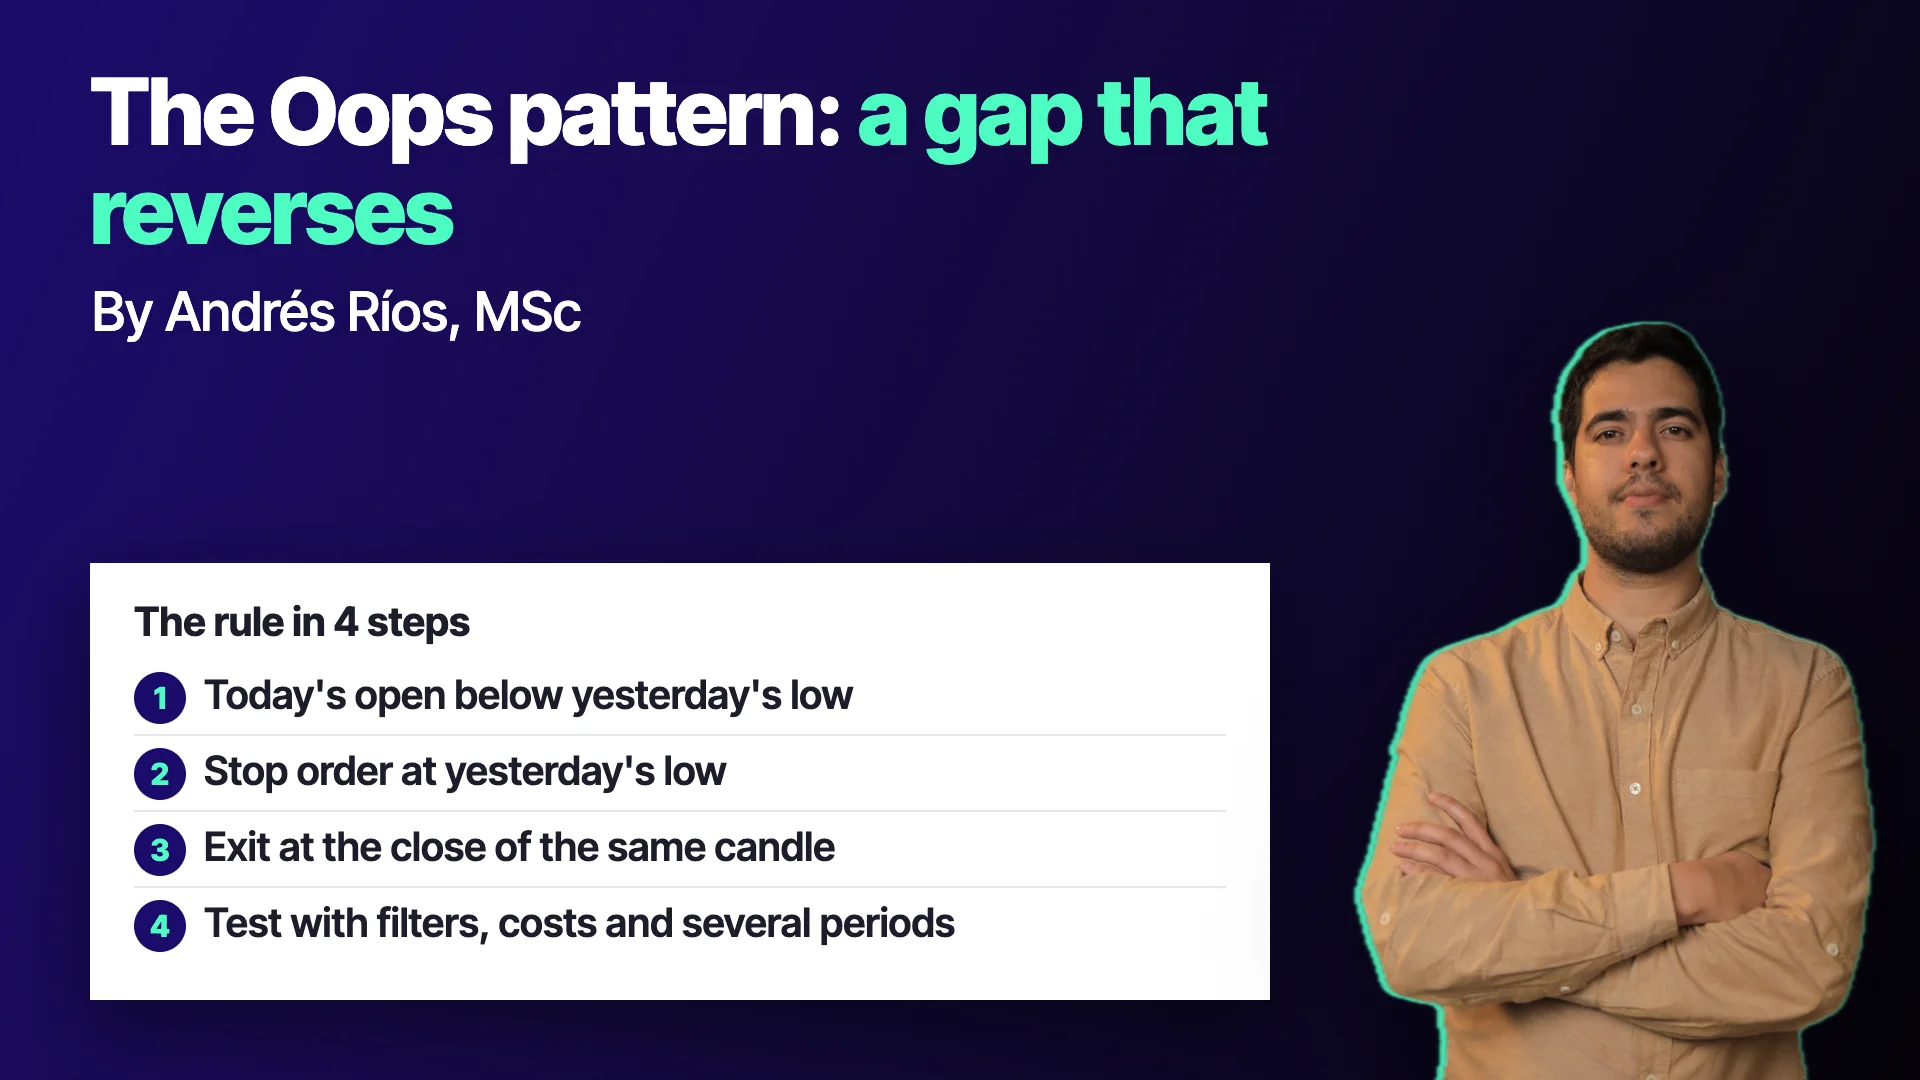
The condition is a single one: today's opening price sits below yesterday's low. That creates a downward gap that leaves the open outside the whole previous range. Up to there it is a measurable fact, with no interpretation.
The pattern's own part is the entry. Instead of trading the direction of the gap, the original rule places a buy stop order at yesterday's low. If price rises and reclaims that level, the trade is triggered; if not, nothing happens. The entry therefore demands a confirmation: that price returns to the range it had just left.
In the version tested in class, the trade lasted a single candle: enter if price touched that level, exit at the close of the same day.
The proposed logic: the herd's mistake
Williams explained why it worked with a behavioral hypothesis: facing a bearish gap in an asset that had been rising, many participants conclude the fall will continue, and that initial panic runs out. Someone who buys when price returns to the prior range is positioned against that reaction.
Take that explanation for what it is: a hypothesis, not a fact. It resembles classic patterns that negate the previous move, such as the abandoned baby, where one gap pushes price in one direction and another gap brings it back. In both, the idea is that the market changed its mind abruptly. A story sounding reasonable does not make it evidence.
Why market conditions matter
When Williams described it, the futures he traded had shorter sessions. That means orders and news piled up between one close and the next open, and the open concentrated a lot of pressure.
Today many futures trade almost around the clock. With extended hours, pressure does not build up at the open in the same way, and the instructor noted that the pattern becomes less obvious and harder to exploit. The methodological takeaway is general: a rule is born in a market environment, and when the environment changes it has to be tested again.
How it is written and tested
The rule can be programmed in a few lines: if today's open is below yesterday's low, place a stop order at that low and exit after one candle. In the class demonstration it was tested on a stock index, with about ten years of daily data and no commissions, because the goal was to see whether there was anything worth studying.
The resulting curve looked attractive but had uncomfortable losing stretches. Changing the days of exposure changed the outcome: with two days the curve looked better, with three the drawdown got worse. It is a class example, not a conclusion, but it illustrates something important: every parameter you move is another decision that can be fitted to the data.
The filters: gap size and stop distance
Williams improved the pattern with two changes. The first was requiring a minimum gap size, measured as a percentage: for example, that the open sit at least 1% below the previous low. The second was moving the entry order slightly above the low, using recent volatility as a reference, so as not to enter exactly at the most obvious level.
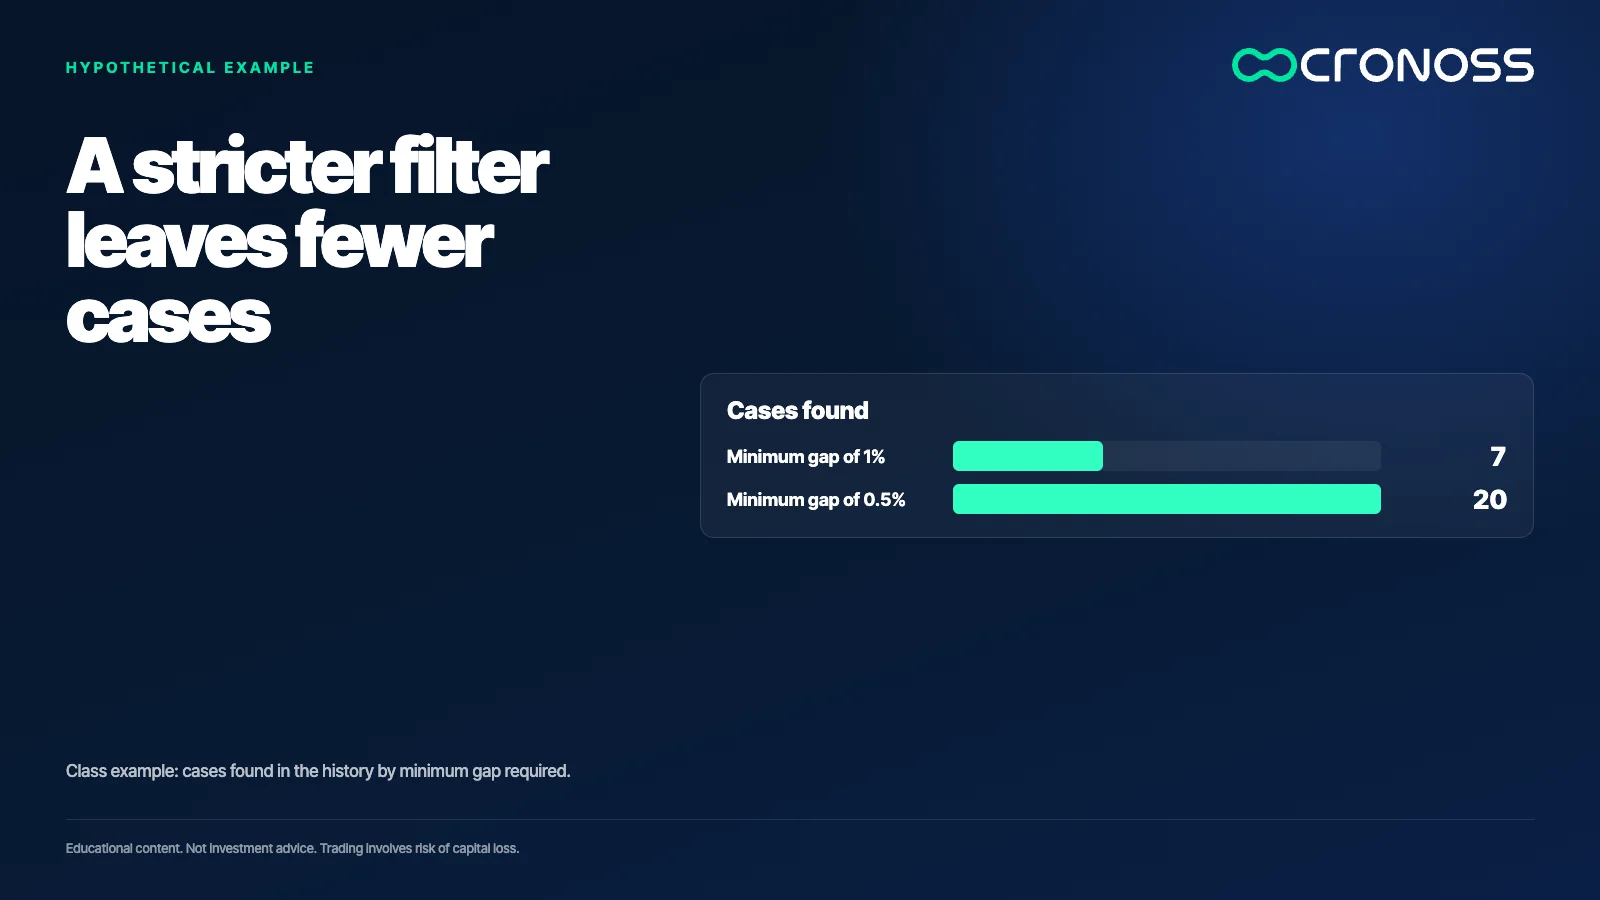
In the demonstration, a 1% minimum gap found only 7 cases in the tested history, and lowering it to 0.5% raised the count to 20. These are figures from a class example, but they show the dilemma: a stricter filter sounds stronger and leaves almost no data. With so few cases, any result can be chance.
The ways it can fail
A pattern like this can fail in several ways, and they are worth naming before testing:
- Too little sample. Filters shrink the signals until there is no statistical basis.
- A different environment. The rule was born with short sessions; testing it on recent data from extended-hours markets may give another result.
- Fitting to the data. Moving gap size, stop distance and days of exposure until the curve looks good is overfitting, not discovery.
- Popularity. A pattern taught in books and courses is no longer a secret. People who know it trade it, and that can erode its edge.
The class also made a general point about technical analysis: many patterns circulate as myths because they were never put through a solid test. Writing the rule and measuring it is the difference between believing and checking.
A three-step test
- Define the gap with numbers. Open, prior low and minimum size as a percentage. No adjectives.
- Count the signals before looking at the curve. If the filter leaves only a few dozen cases or fewer, conclude nothing.
- Test across several periods and with costs. If the result exists only in one period or vanishes once commissions are included, the rule did not hold up.
The hypothesis and the test
The Oops pattern works less as a strategy than as an exercise in method. It has a precise definition, a plausible explanation, filters that can be tuned and several ways to fail. That makes it ideal for learning to tell a convincing story from a measurable edge.
A convincing story about the market is not a test: the test is what is left standing when you try to break it.
To go deeper into how price patterns are evaluated with written rules, the program Análisis Técnico Aplicado (Applied Technical Analysis) works through these examples in detail: see the program.
Educational content. Cronoss is not a broker, investment firm or financial adviser, and nothing above is an investment recommendation.
Frequently asked questions
What is the Oops pattern?
It is a short-term pattern in which the day's open sits below the previous day's low and the entry triggers only if price reclaims that low. It is attributed to Larry Williams and tries to capture an overreaction to a bearish gap.
Does the Oops pattern still work today?
There is no general answer: it depends on the asset, the trading hours and the tested period. Class noted that with extended-hours markets the edge is less obvious, so the rule must be tested on recent data.
Why can a minimum gap size be a problem?
Because a stricter filter leaves fewer cases. In a class example, a 1% minimum gap found only 7 cases and a 0.5% one found 20, too few to draw conclusions.
How do I know whether a pattern is a myth?
Write the rule with numbers, count the signals and test it across different periods with costs included. If it does not survive that test, or nobody has ever run it, treating the pattern as fact is only belief.


