
Key takeaways
- A +40% followed by a -30% leaves the account 2% below the start: steady returns hold up better than big swings.
- Lowering risk per trade when volatility rises protects your ability to keep trading after a bad streak.
- Stress tests ask what happens if conditions change, something backtesting alone does not answer.
- Expectancy matters more than hit rate: you can hit 30% and be profitable, or hit 70% and lose.
- A trade journal and a single strategy applied with discipline let you find out whether the method really works.
Two traders end the quarter with the same cumulative result. One got there on a smooth line, month after month. The other gains 40% in one month and drops 30% the next. On a spreadsheet they look alike, but in the account and in the head they have nothing in common.
Consistency is not measured by the best month, but by what survives the bad ones. And almost all of it is decided before a trade is opened.
Being consistent in trading means building a process that tolerates volatility: sized risk, a system tested under stress and a single strategy applied with discipline.
Why do a +40% month and a -30% month not cancel out?
Percentages do not offset symmetrically. With USD 10,000, a +40% takes the account to USD 14,000. A -30% on that figure leaves it at USD 9,800, which is 2% below the starting point. Recovering a 30% loss takes a gain of about 43%.
That is why moderate, steady returns tell a stronger story than big swings: they are easier to repeat and to sustain psychologically. This is arithmetic, not a promise of results.
Design for volatility, not for the average
In a turbulent environment, the assumptions of a calm market stop working. A portfolio designed for volatility often combines shorter duration in fixed income, lower sensitivity to the stock market and assets with some protection against inflation. It is not a fixed recipe: it is a design question about which part of what you hold becomes fragile when the market moves fast.
Lower the risk per trade when the market heats up
A common rule is to risk a fixed percentage of the account per trade, for example 1%. In more volatile markets it can make sense to cut it in half. The most liquid pairs usually give you time to react; a fast-moving asset can stop you out in a single candle.
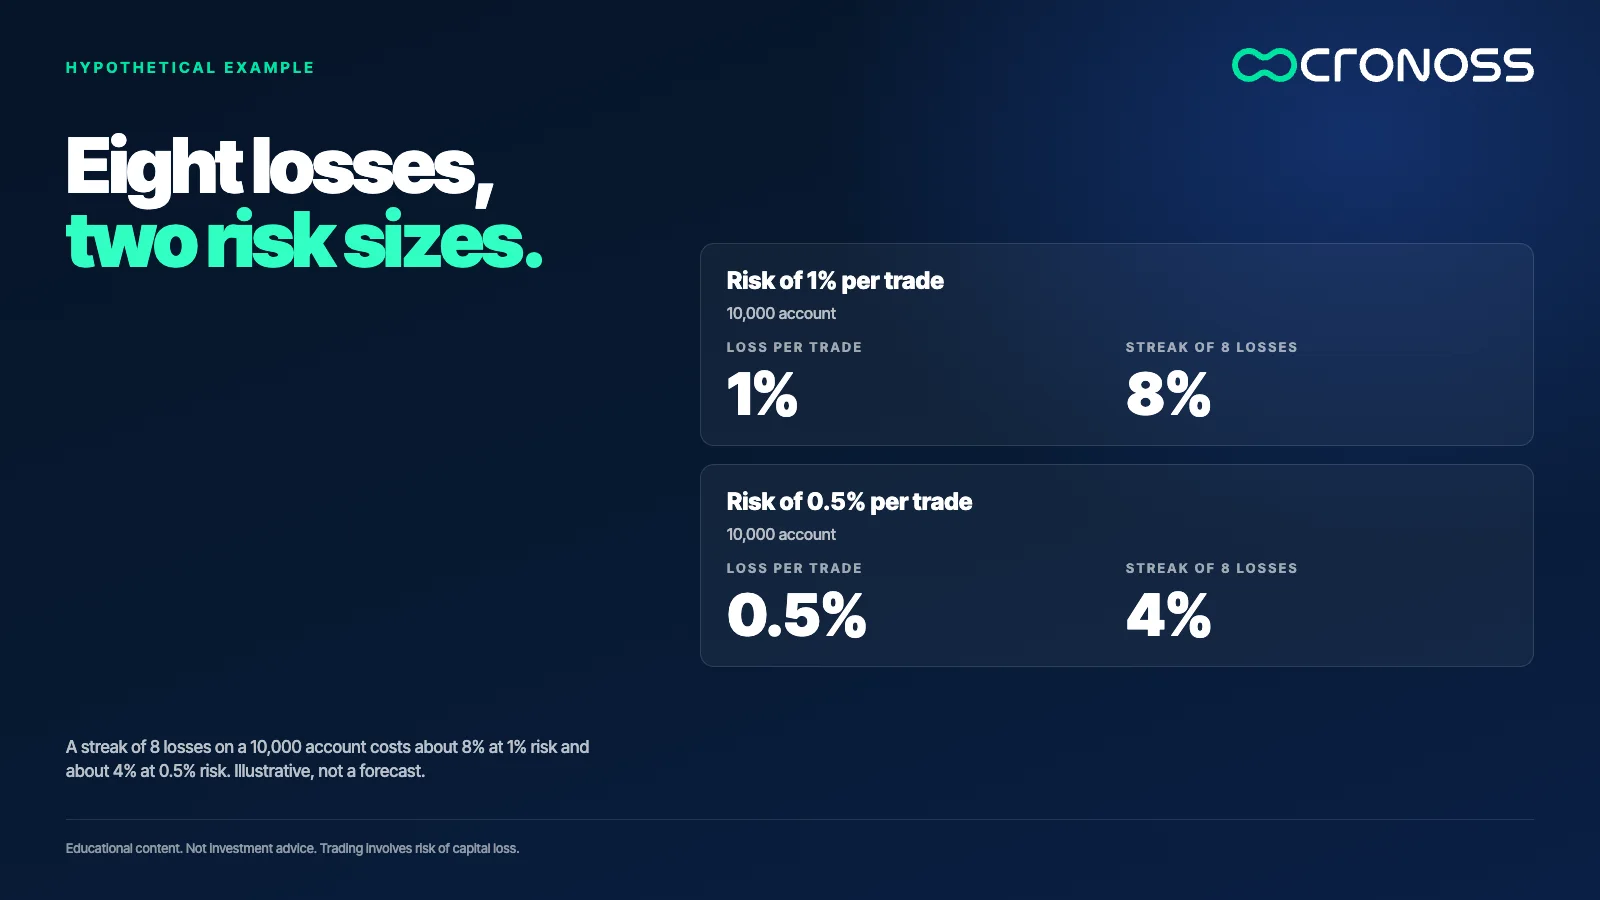
An example with a USD 10,000 account: risking 1% is USD 100 per trade and risking 0.5% is USD 50. A streak of 8 consecutive losses would cost about USD 800 (8%) in the first case and about USD 400 (4%) in the second. The difference is how much it lets you keep trading after the bad streak.
Test the system under stress, not just on the past
Backtesting answers how a strategy would have worked on historical data. Stress tests ask what happens if conditions change: if correlations rise and several assets move the same way, if volatility doubles, if a few trades go wrong in a row.
Probabilities are conditional. A strategy that hits 7 out of 10 in one environment can hit far fewer when that environment changes, and that is when it pays to cut risk instead of pressing on.
Expectancy beats hit rate
Winning more trades is not the same as being profitable. With a 1 to 3 ratio (you win three times what you risk), hitting only 30% of the time can produce a positive result: in 10 trades you win 3 times 3 units and lose 7 times 1, for a balance of +2 units, or +0.2 per trade.
The opposite also happens. Hitting 70% of the time with gains of 0.3 per unit risked leaves a balance of 7 × 0.3 - 3 × 1 = -0.9 over 10 trades. A high hit rate and a negative result in the same system.
A journal to see the whole movie
Without a record, memory selects: you remember the big win and forget the small repeated losses. A journal with entry, risk, result and the reason for the decision lets you measure real expectancy, spot error patterns and compare what was planned with what was executed.
One strategy, repeated
Switching strategies after every bad streak is the most expensive way to learn nothing. No method works in every condition. What works is understanding one in depth, knowing in which environment it performs and in which it does not, and applying it repeatedly while the journal data keeps validating it.
What to review this week
- Define your risk per trade and how much you would reduce it if volatility doubled.
- Calculate your expectancy from your last 30 trades: hit rate, average win and average loss.
- Write a pause condition: what has to happen in the environment or in your account for you to stop trading and review.
None of this removes the risk of loss, which is present in every trade.
Consistency is built before the chart
Someone who only looks at today's result does not see the process that produced it. Someone who measures risk, expectancy and stress can sustain a strategy long enough to find out whether it works.
The market does not reward intensity, it rewards well-sized repetition.
To work on risk and diversification with step-by-step examples, take a look at the program Gestión Aplicada de Riesgo y Diversificación de Capital (Applied Risk Management and Capital Diversification): Gestión Aplicada de Riesgo y Diversificación de Capital.
Educational content. Cronoss is not a broker, investment firm or financial adviser, and nothing above is an investment recommendation.
Frequently asked questions
What does being consistent in trading mean?
It means sustaining a process that tolerates volatility: sized risk per trade, a system tested under stress and a strategy applied with discipline. It is not measured by the best month, but by what survives the bad ones.
Why is hit rate not enough to judge a strategy?
Because the result also depends on how much is won and lost on each trade. With a 1 to 3 ratio, hitting 30% can be profitable, while hitting 70% with very small gains can produce losses.
How much should I risk per trade?
It depends on each person and their plan. A common rule is a fixed percentage of the account, such as 1%, which can be reduced when volatility rises. What matters is that a losing streak does not stop you from continuing to trade.
What is a stress test in trading?
It is an exercise that evaluates how a system would respond if conditions change, for example if correlations rise, volatility doubles or losses come in a row. It complements backtesting on historical data.


