Key takeaways
- An indicator adds no information to price: it summarizes it with a statistics-based formula, so it trails price instead of sitting above it.
- Indicators fall into two families: trend indicators, which help when direction is clear, and oscillators, which measure the strength of the move.
- Every oscillator allows four readings: overbought, oversold, convergence and divergence.
- The MACD subtracts a 26-period exponential average from a 12-period one and compares the result with a 9-period signal line.
- A divergence or an overbought reading usually warns of a pause, not necessarily of a complete trend change.
- Before using an indicator, test its rule on the asset's past and define when you will stop trusting it.
The most common question in any trading community is always the same: what is the best indicator? Behind it there is usually a quiet hope, that of finding a tool that says when to get in and when to get out without the person having to interpret anything.
That tool does not exist. What does exist is a set of formulas that summarize price in different ways, each with conditions where it works well and conditions where it gets things wrong.
An indicator cannot see the future: it summarizes the past of price with a formula, and it is only useful when you know what it calculates and when it fails.
An indicator is computed from price, not on top of it
Every technical indicator starts from the same data already on the chart: open, high, low, close and, sometimes, volume. It adds no new information; it rearranges it. Behind every indicator there is basic statistics, mostly averages and deviations. That is why it trails price, although some react faster than others.
This changes the question. Instead of "what does the indicator tell me?", ask "which part of price is it summarizing, and which part is it leaving out?". An indicator complements price structure; it is not an entry or exit signal by itself, and it does not replace fundamental analysis or risk management.
Two families: trend indicators and oscillators
Technical indicators can be grouped into two broad families. Trend indicators help when the market's direction is clear, rising or falling; moving averages are the classic example. Oscillators mainly measure the strength or impulse of the move, which is why they are usually drawn in a separate panel.
An oscillator answers a different question than a moving average. The average says where the mean of recent prices points; the oscillator says how strongly price is moving. Mixing them without knowing which answers what is a common source of confusion.
Oscillators were born for range-bound markets
Oscillators such as the RSI or the MACD are drawn in a separate panel below the chart and swing around an axis or between two extremes. Their original design assumed sideways markets, where price bounces between a floor and a ceiling.
When the market enters a strong trend, an oscillator can stay in overbought or oversold territory for a long time without price turning back. A signal that would have worked in a range becomes a permanent alarm. That is why parameters get adjusted to the asset and the time frame being traded, not copied as-is from a book.
Every oscillator allows four readings
Whichever one it is, an oscillator can be read four ways: overbought, oversold, convergence and divergence. The RSI is known for the first two. The MACD specializes in the last two.
There is overbought when there is an excess of buyers: price rises and rises without pause. But markets tend to move in waves, something like four steps forward and two back, and those rests are normal. An excess of buyers more likely signals a pause than a reversal.
There is convergence when price and the oscillator do similar things: both rise or both fall. There is divergence when they stop doing so: price keeps going one way and the oscillator turns another. Divergence is the most sought-after reading, and also the most misread one.
The MACD from the inside: two averages and a subtraction
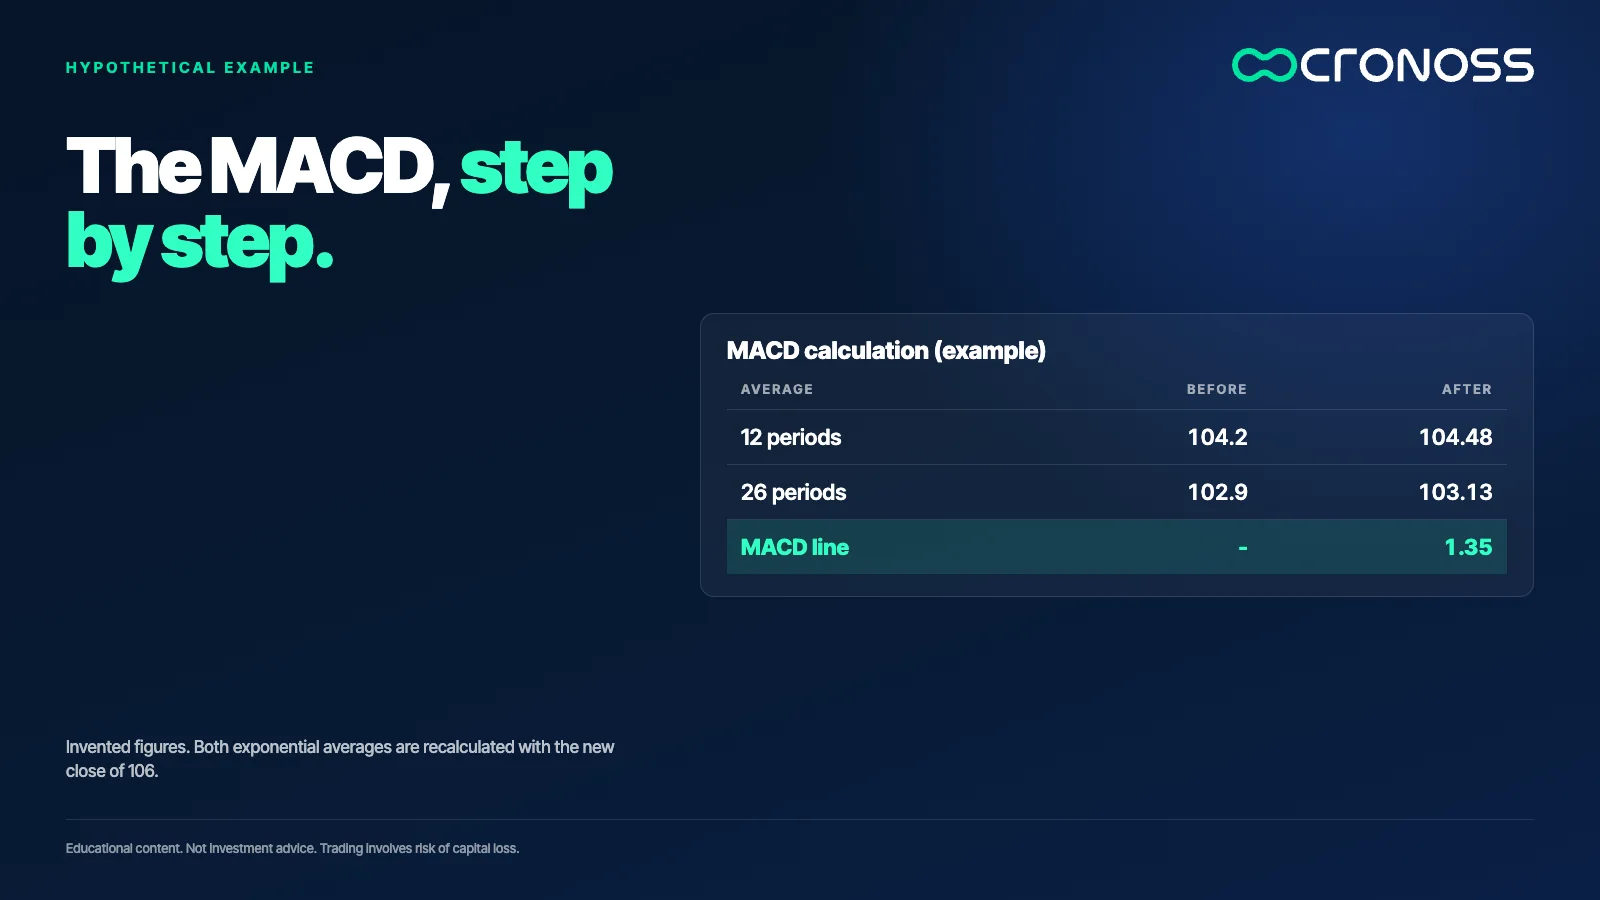
The name explains it: MACD stands for moving average convergence divergence. It is built from two exponential moving averages, one over 12 periods and one over 26. An exponential average gives more weight to recent data through a smoothing factor: 2 divided by the number of periods plus one.
An example with made-up numbers. For 12 periods the factor is 2/13, about 0.154; for 26 it is 2/27, about 0.074. If the 12-period average sat at 104.2 and the 26-period at 102.9, and the new close is 106, the 12-period moves to 0.154 × 10⁶ + 0.846 × 104.2, which is 104.48. The 26-period moves to 0.074 × 10⁶ + 0.926 × 102.9, which is 103.13. The fast one moved 0.28 and the slow one 0.23. The MACD line is the difference between them: 104.48 minus 103.13, equal to 1.35.
The signal line and the histogram show the pulse
Another exponential average, over 9 periods, is computed on the MACD line and called the signal line. When the MACD crosses the signal, the momentum of one side is giving way to the other. The bars in the panel, the histogram, measure the distance between those two lines.
If the histogram grows, the strength of the current direction is rising. If it shrinks while price keeps advancing, that strength is wearing out. Picture a histogram going from 0.30 to 0.10 while price prints a new high: price rose, but with less push. That is information to watch, not an order.
A divergence points to a possible pause, not always a turn
If price makes a higher high and the MACD makes a lower one, there is a bearish divergence: the move advances with less backing. It is the reading with the longest tradition, and it deserves caution. A divergence usually warns of a pullback, a rest inside the market's normal zigzag, and not necessarily of a trend change.
Mixing the two up has consequences. Someone who expects a full reversal and gets only a pause of a few candles ends up on the wrong side of the current. Trading against the trend can be a valid strategy, but it demands more precision and a smaller risk.
Before trusting it, test it on the past
Technical analysis rests on historical data and has a clear limit: markets are not an exact science. They look more like a random walk where new variables arrive with different weights, and no formula gathers them all. History proves nothing by itself, but it does allow measuring.
The way to measure is backtesting: take the rule you want to use the indicator with and review what would have happened on the asset and period you trade. With made-up numbers: if a MACD-based rule gave 40 signals over five years and in 24 of them price moved in the expected direction, the historical hit rate was 60%. That guarantees nothing going forward, but it is already different information from a hunch. And since markets change, the test gets repeated every so often.
When not to trust an indicator
Four situations are worth recognizing early:
- A market with no clear direction. Crossovers multiply and most of them turn out to be false information.
- A strong trend read with a range oscillator. Overbought can last far longer than the patience of whoever waits for it.
- An indicator used alone. Without price structure or candles backing it up, it becomes a bet dressed in technical vocabulary.
- Copied parameters. A setting designed for another asset or time frame changes how the formula behaves.
A three-step test before using any indicator
- Write down what it calculates. If you cannot describe the formula in one sentence and say what data it uses, you do not understand it yet.
- Read price first. Define the trend and the levels. The indicator comes after, to reinforce or question that reading.
- Decide when you will not use it. Before trading, define the market condition in which that indicator stops being reliable.
Understanding the tool is the edge
Two people can look at the same MACD and reach opposite conclusions. The difference is not in the tool but in how much they know about what is inside it. Whoever knows the formula knows what to ask of it and what not to.
If you want to go deeper into how the most popular indicators work inside and when not to trust them, the program Análisis Técnico Especializado en Indicadores (Specialized Technical Analysis with Indicators) covers moving averages, Bollinger Bands, ADX, Fibonacci, RSI and MACD: Análisis Técnico Especializado en Indicadores.
Educational content. Cronoss is not a broker, investment firm or financial adviser, and nothing above is an investment recommendation.
Frequently asked questions
How is the MACD calculated?
The MACD line is the difference between a 12-period and a 26-period exponential moving average. A 9-period exponential average of that line gives the signal line. The histogram shows the distance between the two.
What is a divergence in an oscillator?
It happens when price and the oscillator stop moving in the same direction, for example a higher high in price and a lower high in the oscillator. It warns the move is losing backing, but it does not confirm a turn.
Why do oscillators fail in strong trends?
Because they were designed for markets that swing within a range. In a strong trend they can stay overbought or oversold for a long time while price keeps advancing.
Can you trade using a single indicator?
It is not advisable. An indicator complements price structure, and without levels, candles or risk management behind it, it is an incomplete reading.
What is the difference between a trend indicator and an oscillator?
A trend indicator, such as a moving average, shows where the average price points when direction is clear. An oscillator measures the strength or impulse of the move and is usually drawn in a separate panel.
What is backtesting an indicator for?
It reviews what would have happened in the past by applying an indicator-based rule on the asset you trade. It guarantees no future results, but replaces a hunch with a measurement.


