
Key takeaways
- A candle sums up the fight between buyers and sellers over one period; what matters is who is winning, not what the shape is called.
- A candle much larger than its neighbors is an alert that asks for attention, not an order to act.
- Wicks show how far price went and could not hold; ignoring them means missing half the story.
- The anatomy of a candle can be measured: body over range and body position in thirds let you classify a doji with numbers.
- A reversal pattern needs a prior trend to reverse; with no direction, the figure means nothing.
- Wait for the candle to close: while it forms, what you see is a hypothesis and not yet a candle.
A Japanese candlestick fits in one rectangle and two lines, yet many people reduce it to a single question: did the price go up or down? That reading throws away most of what the candle says: who pushed the price, how far it got, and who could not hold the move.
The opposite mistake is just as common: memorizing pattern names (doji, hammer, shooting star) and treating them as buttons to press. A name with no context says nothing about what price will do next.
A candle is not a signal, it is an alert, and it only means something when you read it next to a chart level and after it closes.
What a candle tells you: a fight between two sides
Behind every price there are buyers hoping it rises and sellers hoping it falls. The candle sums up that fight over one period. So the useful question is not what the shape is called, but who is winning and who is wearing out.
Each candle is built from four prices: open, close, high and low. The body is the distance between open and close. The wicks (also called shadows) are the ground price covered and could not keep.
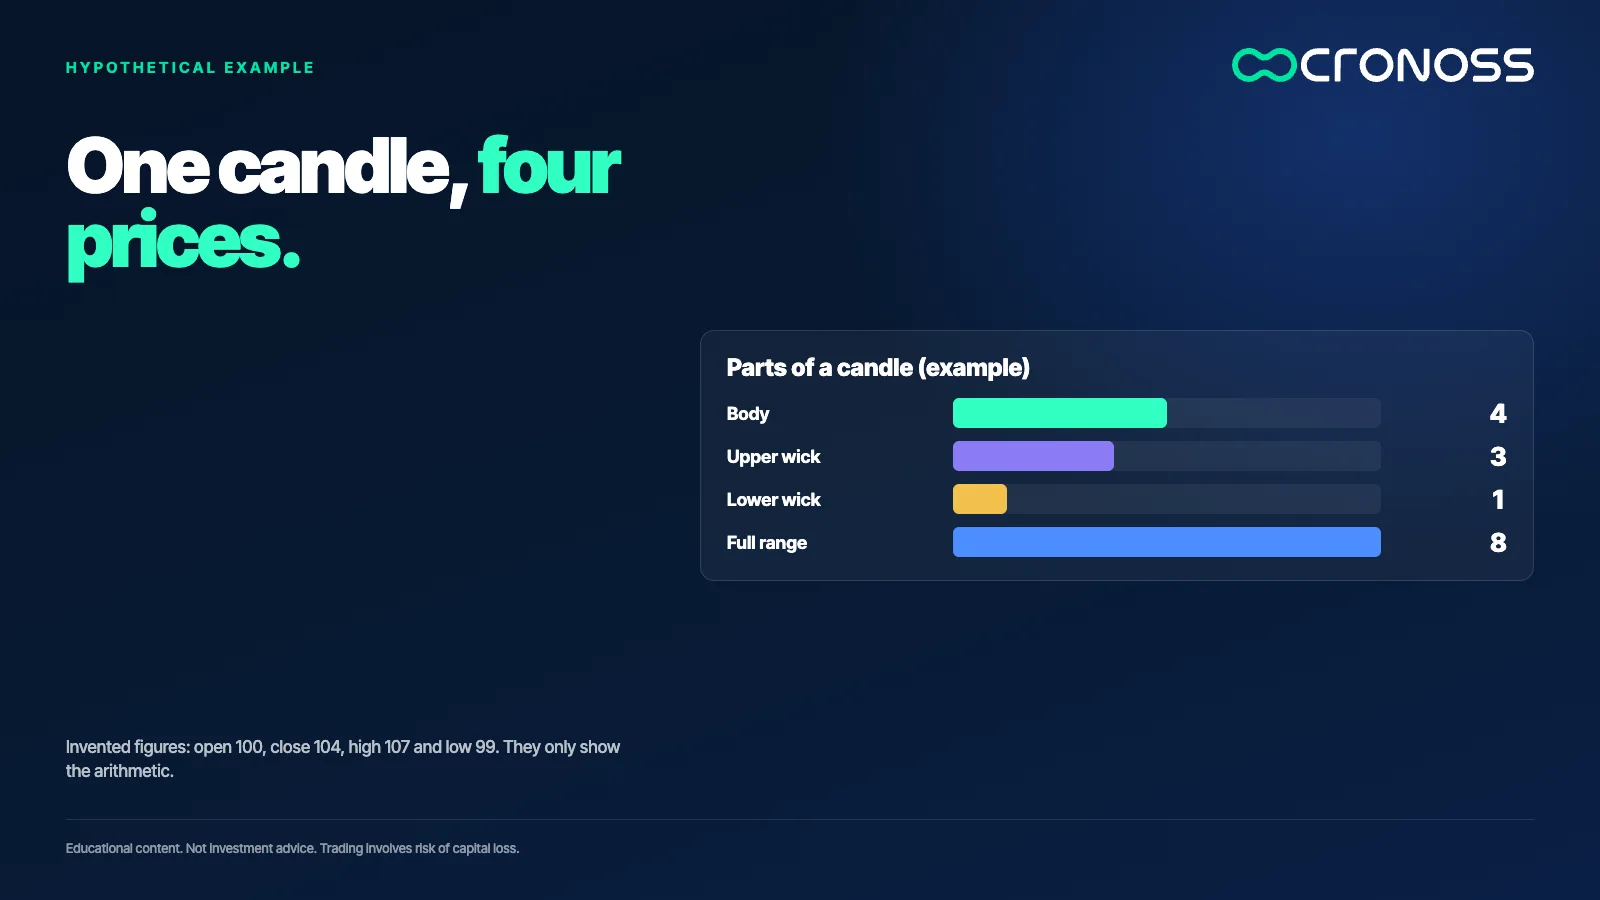
An example with made-up numbers, only to see the arithmetic: a candle opens at 100, closes at 104, reaches a high of 107 and a low of 99. The body is 4; the upper wick is 3 (107 minus 104); the lower wick is 1 (100 minus 99); the full range is 8. Buyers pushed price 7 units above the open, but by the close they had given back 3. The candle went up, and still it tells you there was opposition above.
An unusual candle is a warning light on the dashboard
Before reading a candle, compare it with the ones around it. A body much larger than the rest usually goes with heavier trading and a wider price swing. That is not a detail: it is something abnormal on the chart.
A car dashboard is a good analogy. When a warning light turns on, you do not know the engine will fail, but you know you should look. A big candle does the same: it asks for attention, not obedience. It is a graphic representation, not an absolute truth.
Wicks are the footprint of what price tried to do
A long upper wick means buyers reached that price and could not stay there. A long lower wick says the same about sellers. Ignoring a wick means missing half the story, because it marks where trading happened even if the close ends up far away.
Indecision candles have a small body and long wicks. Open and close end up nearly equal, as in the doji or the spinning top. They tend to show up when one side is running out of steam, so they are an alert of a possible change. An alert is not a confirmation: the change may never come.
The anatomy of a candle can be measured
Candle reading has a reputation for being subjective, but part of it can be turned into numbers. An indecision candle such as the doji is defined by the relation between its body and its range: the body divided by the difference between high and low. In the earlier example, 4 ÷ 8 gives 0.5; a doji would have a value close to 0.
The body can also be placed inside the range by splitting it into thirds. With a high of 107 and a low of 99, the boundaries are 101.67 and 104.33 (99 plus 8 ÷ 3, and 99 plus 2 × 8 ÷ 3). The midpoint of the example body is 102, which falls in the middle third. When the small body sits in the lower third the doji is known as a gravestone; in the middle, as a long-legged doji; and in the upper third, as a dragonfly. Each position is read differently, and defining it with numbers lets two people, or a program, classify the same candle the same way.
Levels give the candle its meaning
The same candle means different things in the middle of nowhere and right at a level price has already respected. A simple habit is to draw a horizontal line across highs the market touched at different moments. If price reached that zone three times and turned back, the zone has history.
Levels also change roles. When price settles above a resistance, that zone can start working as support, like going from the first floor of a building to the second and using the old ceiling as the new floor. That is why it pays to find the level first and read the candle second.
No close, no candle: only guesses
A forming candle can still change shape. Until it closes, what you see is a hypothesis. Waiting for the close keeps you from acting on a shape that may disappear.
Picture this: price reaches a known ceiling and a long upper wick forms. It looks like a warning. But the candle ends up closing above the level with a strong body, and no red candle with selling force ever appears. The alert never became a signal. Reaching a ceiling does not mean price will turn back; you need a candle that shows sellers have the strength.
A false breakout is a level that is passed and then given back
Sometimes price pushes through a level but almost immediately slips back below it. That is a false breakout: the market tried and lacked the strength to hold it. A valid breakout normally stays on the other side for several candles and moves on.
Candle reading helps tell them apart, but it is not enough alone. Combining it with trading volume or other tools cuts the cases where a breakout turns out to be a feint. And a phrase like "it has already risen a lot" or "it has already fallen a lot" is not an argument: what counts is what the chart shows at that moment.
A reversal pattern needs something to reverse
Reversal models, such as the double top or head and shoulders, aim to identify reversals. A reversal is the equivalent of a U-turn on a road, and a U-turn only makes sense if there was a direction before. That is why the first thing to verify is the trend: what the asset has done over the last days and whether it was rising, falling or moving sideways.
Many complaints of the type "this pattern doesn't work for me" dissolve once you review the cases: the figure showed up anywhere and in any direction, and something was expected to happen on its own. A reversal figure with no prior trend has nothing to reverse. Also, anyone looking for reversals trades against the current: risk is higher and targets are usually shorter than in trades with the trend.
A pattern without context is just a name
There are over a hundred named patterns, and learning them by heart matters least. What is worth doing is checking each figure on the asset and period you trade: review what happened every time it appeared, an exercise whose formal version is called backtesting, without assuming that what worked before will always work. A pattern carries weight when it shows up at a relevant level and when the neighboring candles back it up. Even patterns with a reliable reputation, such as three bearish candles in a row, mean more inside a developed trend than at the start of a move.
There is also a limit worth accepting from day one: candle reading is subjective and technical analysis is not an exact science. It complements fundamental analysis, it does not replace it.
A three-step test for any chart
- Mark the levels. Draw horizontal lines where price has turned at least twice.
- Read and measure the candle. Look at the body, the wicks and the size against the previous candles, and compute what share of the range the body takes. Ask who won and who wore out.
- Wait for the close and the next candle. If no candle shows strength in the direction you imagined, the alert is still just an alert.
The best practice is to go back through an asset's history and read candle by candle what happened, writing down what you expected before moving ahead and comparing it afterward. It is the cheapest way to build experience without putting capital at risk.
Reading is not predicting
Candles do not foresee the future: they put the recent past in order so a person can decide with judgment. Someone who reads them next to a level and waits for the close decides with information. Someone who memorizes them as automatic signals ends up guessing with technical vocabulary.
If you want to train this reading with step-by-step examples, the program Análisis Técnico Aplicado (Applied Technical Analysis) covers indecision candles, reversal patterns, reversal figures and false breakouts: Análisis Técnico Aplicado.
Educational content. Cronoss is not a broker, investment firm or financial adviser, and nothing above is an investment recommendation.
Frequently asked questions
What do the body and wicks of a Japanese candlestick mean?
The body is the distance between the opening and closing price. The wicks show prices reached during the period that were not held at the close. Together they show who pushed price and who answered.
Why does an indecision candle not confirm a trend change?
Because it only shows neither side managed to impose itself in that period. It is an alert of a possible change, and confirmation comes only if the next candles show strength in the opposite direction.
Why wait for the candle to close?
A forming candle can change shape until the last moment. Waiting for the close keeps you from acting on a shape that may vanish before it completes.
How do you tell a false breakout from a valid one?
A false breakout passes the level but slips back below it almost immediately. In a valid one price stays on the other side for several candles. Combining the candle with volume helps filter out the feints.
How can you measure a doji with numbers?
Divide the body by the candle range (high minus low): a doji gives a value close to 0. Then split the range into thirds and see which one holds the body midpoint, which tells gravestone, long-legged and dragonfly apart.
Why does a reversal pattern sometimes fail?
Because a reversal figure needs a prior trend to reverse. If it shows up with no clear direction, or is read in isolation, it has nothing to change. Check the trend and test the figure on the asset you trade.


