
Key takeaways
- The profit factor is the ratio of a strategy's gross profits to its gross losses.
- A profit factor of 1 loses money in practice, because commissions, spread, slippage and swaps subtract from every trade.
- The profit factor, win rate and risk reward are tied together: win rate = PF ÷ (PF + RR).
- Most robust strategies have a profit factor between 1.5 and 2.5.
- To measure it properly, the backtest must include costs and use a fixed lot size or results in pips.
A strategy with a profit factor of 1 earns exactly what it loses. After commissions and spread, it loses money. The profit factor is the ratio of a strategy's gross profits to its gross losses.
It indicates how many units a strategy earns for each unit it loses. That number reveals whether a strategy is profitable and how much margin it has against costs, and a single equation ties it to the win rate and the size of the gains.
What exactly does the profit factor measure?
The profit factor measures how much money a strategy earns gross for every unit of money it loses gross. Its formula is direct:
PF = gross profit ÷ gross loss
Gross profit sums the result of all the winning trades. Gross loss sums, in absolute value, the result of all the losing trades. With a profit factor of 1.5, the strategy earned USD 1.5 for every USD 1 it lost.
The value 1 marks the theoretical frontier. Above it, the strategy accumulates more than it gives up. Below it, it gives up more than it accumulates.
Its advantage is the immediate reading: a single ratio says whether the strategy adds or subtracts. Its weakness appears when someone reads it in isolation, because the same profit factor can come from very different trading structures.
How does it relate to the win rate and the risk reward?
The profit factor can be written entirely in terms of the win rate and the risk reward. That equivalence explains almost everything the metric says about a strategy.
The win rate is the proportion of trades that close in profit. Its complement, the loss rate, equals 1 minus the win rate. The risk reward, in this metric, is the average gain divided by the average loss.
Gross profit equals the number of winning trades multiplied by the average gain. Gross loss follows the same logic with the losing trades. By dividing both quantities by the total number of trades, the profit factor becomes:
PF = (win rate × average gain) ÷ ((1 − win rate) × average loss)
The two averages are grouped into the risk reward, and the expression simplifies:
PF = (win rate × RR) ÷ (1 − win rate)
Solving for the win rate reveals the most useful relationship in practice:
win rate = PF ÷ (PF + RR)
The three numbers are tied together: if one changes and another stays fixed, the third necessarily moves. With a constant profit factor, raising the win rate forces you to accept a lower risk reward. With a constant risk reward, the win rate only rises if the profit factor rises.
The equation has an operational translation. A farther profit target increases the risk reward, but price reaches it less often. A closer target is hit more often and leaves less per trade. No exit adjustment escapes that trade-off.
What does the break-even curve show?
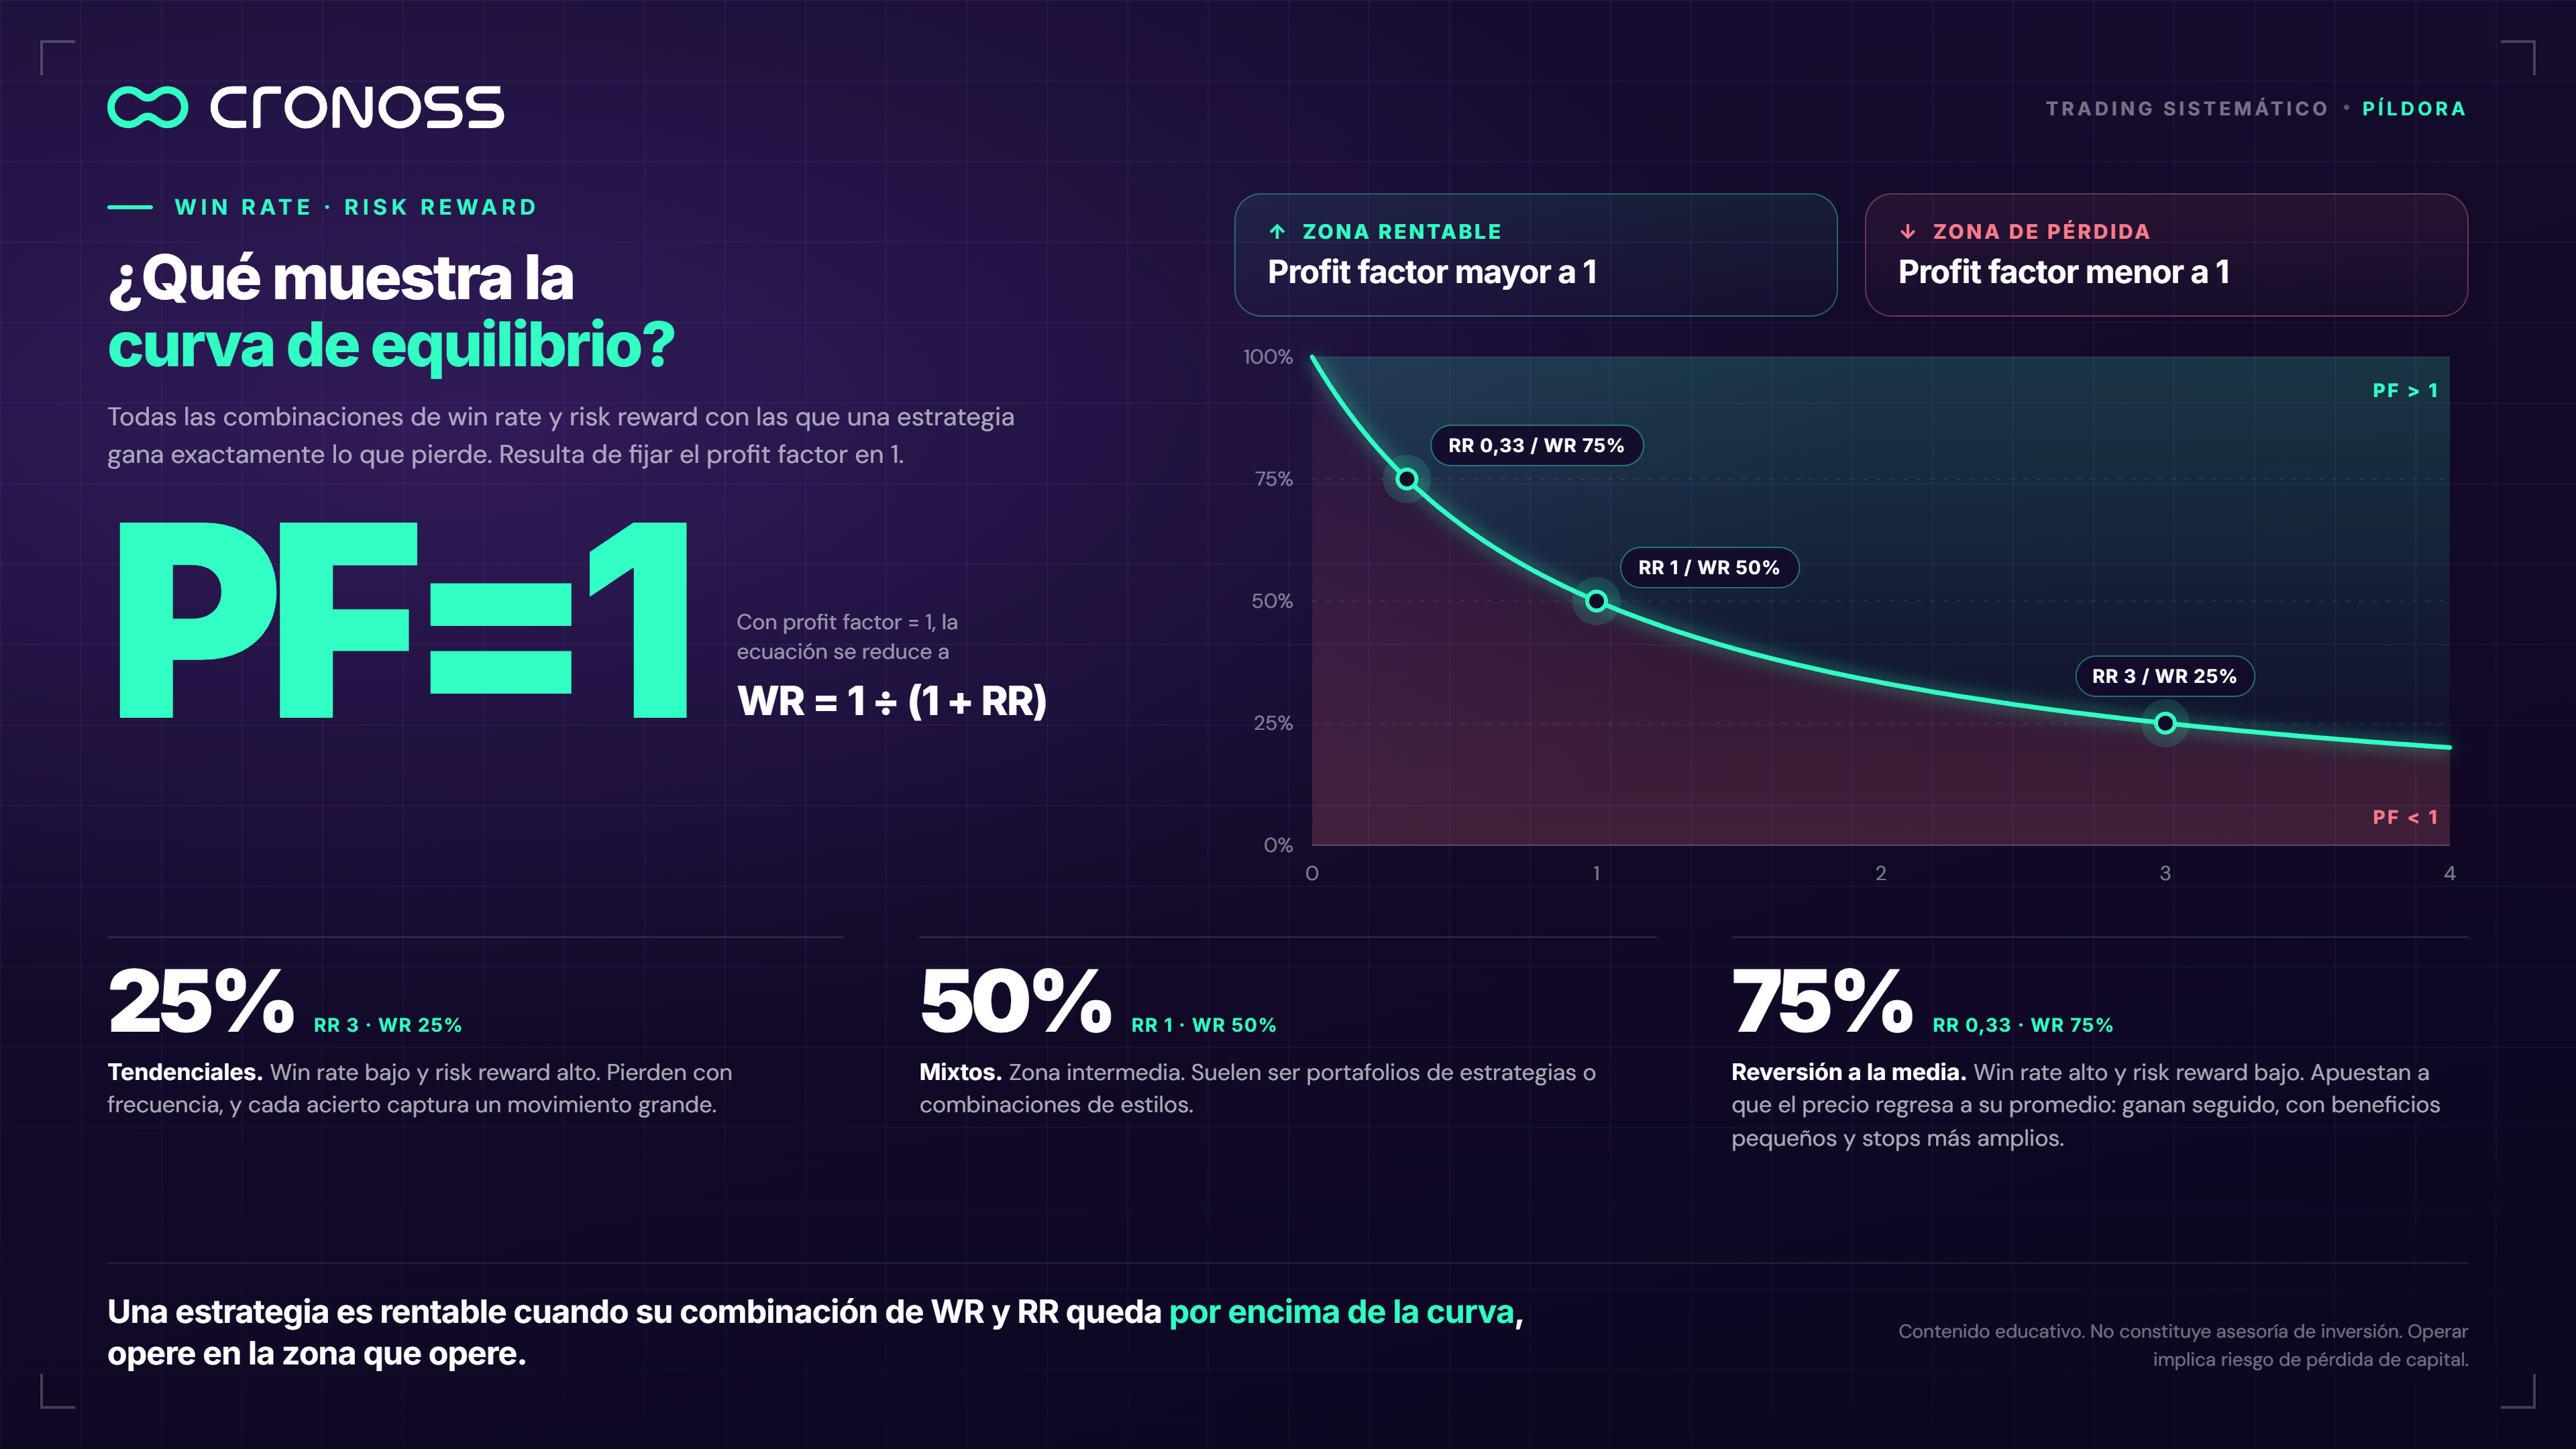
The break-even curve shows every combination of win rate and risk reward with which a strategy earns exactly what it loses. It results from fixing the profit factor at 1, which reduces the equation to win rate = 1 ÷ (1 + RR).
With a risk reward of 3, break-even sits at a 25% win rate. With a risk reward of 1, it rises to 50%. With a risk reward of 0.33, the strategy needs to win 75% of the time.
Each zone of the curve corresponds to a strategy style:
- Low win rate and high risk reward. This is the zone of trend-following strategies. They lose often, but each win captures a large move.
- Middle zone. Here are the mixed systems. They are usually portfolios of strategies or combinations of styles.
- High win rate and low risk reward. This is the zone of mean reversion, which bets that price returns to its average. These strategies win often, with small gains and wider stops.
The curve draws the same frontier for all three styles. A strategy is profitable when its combination of win rate and risk reward sits above that line, whatever zone it trades in.
Why does a profit factor of 1 lose money?
A profit factor of 1 loses money because execution costs subtract from every trade and push the real break-even point above 1. Those costs include commissions, spread, slippage and swaps.
Spread is the difference between the buy price and the sell price. Slippage is the distance between the expected price and the executed price. Swap is the cost of holding a position open from one day to the next. All four shrink the winners and enlarge the losers.
A hypothetical example shows the scale of the effect. Strategy A closes 100 trades: 40 winners averaging USD 150 and 60 losers averaging USD 80. Its gross profit totals USD 6,000 and its gross loss, USD 4,800. The profit factor comes out at 1.25.
The equation holds with these data. Strategy A's risk reward is 150 ÷ 80 = 1.875. The calculation 1.25 ÷ (1.25 + 1.875) returns a win rate of 0.40, the same 40% observed.
Now Strategy A pays a cost of USD 10 per trade. Each winner nets USD 140 and each loser costs USD 90. Gross profit falls to 5,600, gross loss rises to 5,400 and the profit factor drops to 1.04.
Strategy B also closes 100 trades: 50 winners of USD 160 and 50 losers of USD 80. Its profit factor is 2. With the same USD 10 cost, it comes to 7,500 against 4,500, that is, 1.67.
Both strategies pay USD 1,000 in costs. A falls from 1.25 to 1.04 and sits at the edge of break-even; B drops from 2 to 1.67 and keeps a comfortable margin. The difference lies in the margin each one started with.
What profit factor value is good?
According to the class scale, most robust strategies fall between 1.5 and 2.5. The full scale reads as follows:
- PF less than or equal to 1: losing. The strategy does not work.
- Between 1 and 1.5: marginal. It can win, but it is fragile and any change breaks it.
- Between 1.5 and 2.5: solid.
- Greater than 3: very high. It may be real, but it demands skepticism, because it is hard to sustain over time.
Strategy A in the example falls into the marginal zone even before costs. That shows the fragility the scale describes: USD 10 per trade nearly erases its edge.
A high profit factor also makes the strategy more stable and easier to combine with others.
What are the two most frequent mistakes when using it?
The first mistake is reading the profit factor of a backtest without costs as if it were the real one. The second is calculating it with a position size that changes over time.
The first mistake overstates the edge. A backtest is a simulation of the strategy on historical data, and it often runs without commissions or spread. The result describes a frictionless market that nobody trades. Strategy A shows how much the reading can change.
The second mistake distorts the weight of each trade. With compound interest or variable lot sizes, volume grows with the account, and recent trades move more money than older ones. In dollars, the final stretch of the history ends up dominating the profit factor.
The class proposes two corrections. The first is to run the backtest with a fixed lot size, that is, the same volume on every trade. The second is to measure results in pips or points, the minimum units of price variation, instead of in money.
What can you review in your own history?
Three checks are enough to test the profit factor of any trade record:
- Calculate the profit factor in money and in pips. If the two values diverge a lot, position size is distorting the metric.
- Recalculate it after deducting the real costs of each trade. If it drops below 1.5, the record enters the marginal zone of the scale.
- Calculate the win rate, risk reward and profit factor separately, and check that win rate = PF ÷ (PF + RR). If the equality fails, there is an error in the data or the platform defines some metric differently.
The third check is the most demanding. If the three numbers do not reconcile, no analysis built on them is reliable.
What does the profit factor leave unanswered?
The profit factor leaves unanswered how the path unfolded. Two strategies with the same value can go through very different drawdowns before reaching the same result.
The reasonable criterion is to use it as a first filter: it discards what is fragile, flags what is suspicious and leaves the question about the risk of the path to other metrics.
That question organizes the rest of Cronoss's program Métricas de Performance y Evaluación de Estrategias de Trading (Trading Strategy Performance Metrics and Evaluation). The class Profit Factor develops this equation and the break-even curve step by step. The next class, Recovery Factor, measures a strategy's ability to recover from its worst drawdown. Explore the full program Métricas de Performance y Evaluación de Estrategias de Trading.
Educational content. Cronoss is not a broker, investment firm or financial adviser, and nothing above is an investment recommendation.
Frequently asked questions
What is the profit factor?
It is the ratio of a strategy's gross profit to its gross loss. It shows how many units it earns for each unit it loses: with a profit factor of 1.5, the strategy earned USD 1.5 for every USD 1 it lost.
What profit factor value is good?
A value equal to or below 1 is a losing strategy. Between 1 and 1.5 is marginal and fragile. Between 1.5 and 2.5 is solid. Above 3 is very high and calls for skepticism, because it is hard to sustain over time.
Why does a profit factor of 1 lose money?
Because execution costs (commissions, spread, slippage and swaps) shrink the winners and enlarge the losers on every trade, which pushes the real break-even point above 1.
How does the profit factor relate to win rate and risk reward?
The relationship is win rate = PF ÷ (PF + RR). If the profit factor stays fixed, raising the win rate requires accepting a lower risk reward, and vice versa.