
Key takeaways
- Define the question before you filter: without a clear goal, any screener returns the list everyone already knows.
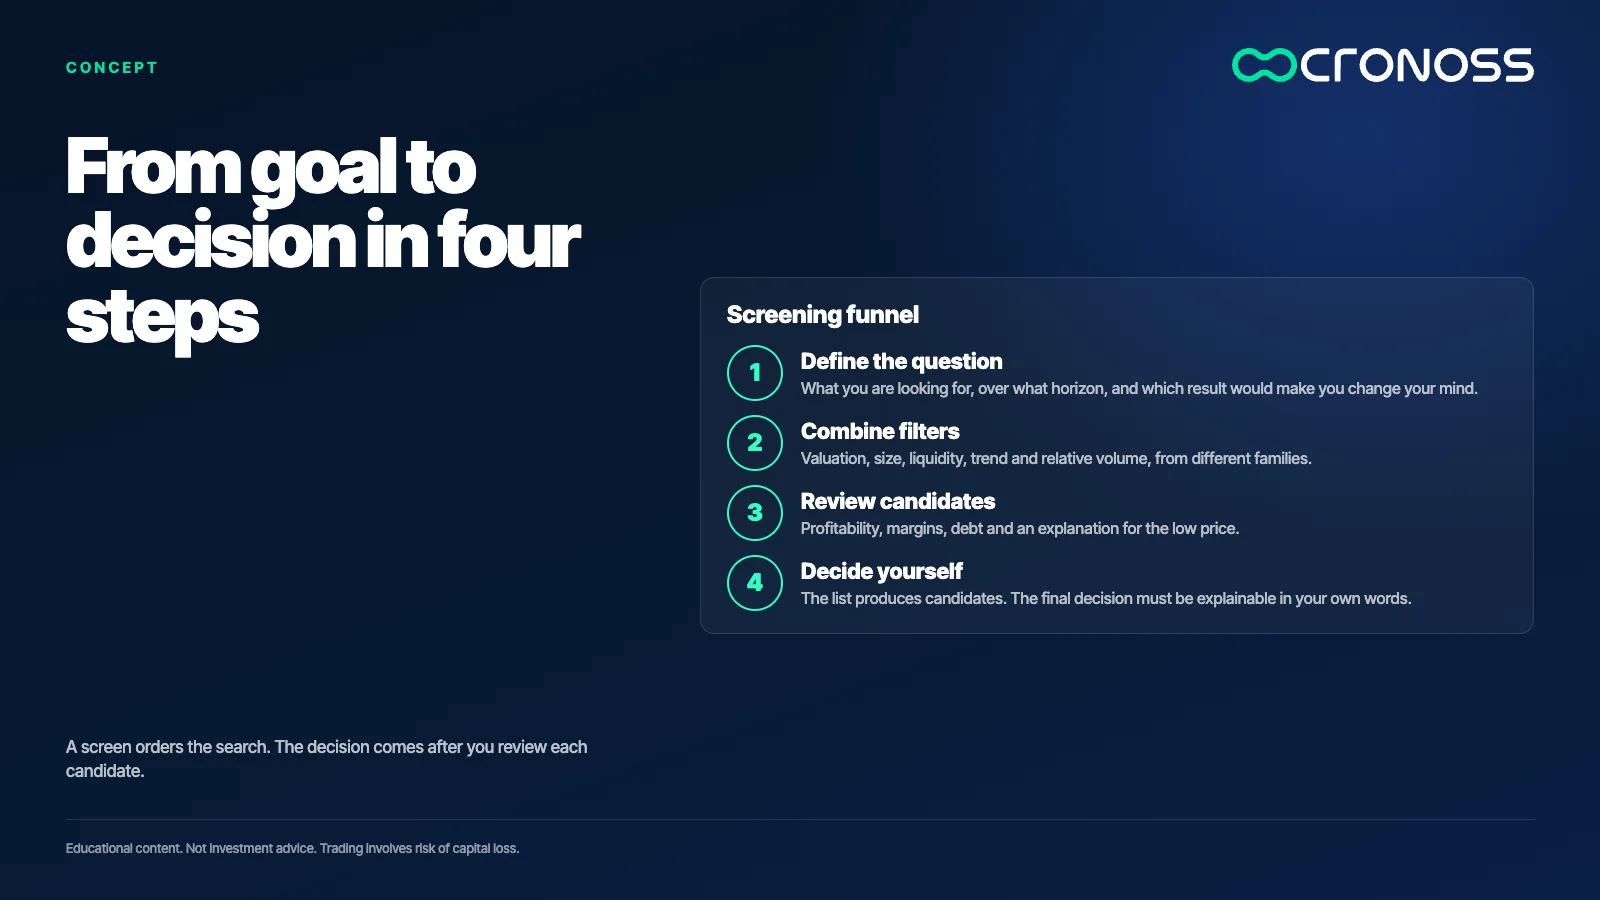
- No single indicator is enough: combining valuation, size, liquidity, trend and relative volume reduces the risk of one misleading figure.
- Price to book compares market price with accounting equity, but a low reading does not prove that a company is cheap.
- A low indicator is a question to investigate: margins, debt and business evolution show whether it is an opportunity or a trap.
- Screening produces candidates, not decisions: the final conclusion requires your own research and a judgment you can explain.
Many people start looking for investment ideas by reading analyst lists or by following whatever a famous commentator says on television. It is an understandable starting point, but it leaves the important question unanswered: why this idea and not another, and what would have to happen for it to stop making sense.
That territory is called screening, or filtering stocks and ETFs. Used well, it turns a universe of thousands of assets into a short list of candidates you can study. Used badly, it becomes a table of numbers nobody knows how to read. Many beginners never write down why they picked an idea, so they cannot learn from the result when it turns out differently than expected.
Screening does not decide for you. It orders the search so your judgment has something to work with.
Define the question before the filter
Before opening any tool, write down what you are looking for. A question such as "which mid-sized companies look cheap relative to their equity and trade with good liquidity" lets you choose concrete filters. A vague question such as "which stocks are good" does not let you choose anything, and the result will be the list everyone already knows.
The question also limits risk. If you are looking for large, heavily traded companies, there is no point in scanning assets that almost nobody buys or sells. Defining the goal first prevents a common habit: adjusting the filters afterwards until the result you already wanted appears.
A useful test is to write, next to the question, which result would make you change your mind. If you cannot write it, you do not have a question ready to filter.
Why no single indicator is enough
A single indicator measures one side of a company or an asset. That is why screening works with combinations of different filter families, for example:
- Valuation. Ratios such as price to book or price to earnings.
- Size. Market capitalization, to separate large companies from small ones.
- Liquidity. Trading volume, to know whether you can get in and out without moving the price.
- Trend. Recent price behavior, for example over the last few months.
- Relative volume. Today's volume compared with its average, to spot unusual activity.
Each filter answers a different question. Combining them shrinks the list, but it does not turn the list into an answer. What it does is force you to think about what each result means.
Liquidity deserves its own attention because it is often forgotten. A company can look attractive on paper and still be hard to sell when you need to, especially if daily volume is low. For that reason, it is worth filtering for liquidity first and for valuation second, not the other way around.
Price to book: what it measures
Price to book compares a company's market price with its book value, that is, the equity that appears in its financial statements. The formula is direct:
Price to book = price per share / book value per share
A result below 1 means the market pays less than the accounting equity for each share. A result above 1 means it pays a premium over that equity.
Worked example with made-up numbers: a company has accounting equity of USD 500 million and 50 million shares. Its book value per share is USD 500 million / 50 million = USD 10. If the stock trades at USD 7, the ratio is USD 7 / USD 10 = 0.7.
A low value can be a trap
A result of 0.7 looks like an opportunity, but it only describes a relationship between two figures. Treat it as a clue about where to dig, not as a verdict on the company. It may reflect a market mistake, but it may also reflect something real: assets that are losing value, losses that do not yet show clearly in equity, a business that does not generate cash, or a declining sector. In those cases, book value says little about what the company will be able to produce in the future.
Book value also depends on accounting criteria, such as how assets are measured or when losses are recognized. Two similar companies can show different equity for reasons that have nothing to do with their quality. That is why a low ratio is a question to investigate, not a conclusion.
This is a risk point: a wrong reading can cost you real capital.
Cross-check with other signals
To check whether a low ratio is an opportunity or a trap, look at other dimensions of the same company:
- Profitability. Does it sustainably generate a return on its equity or on the capital it has invested?
- Operating margin. Does the core business make money before financing and taxes?
- Evolution. Are revenue and margins falling, holding steady or rising over several years?
- Debt. How much does the company owe compared with its ability to pay?
If the cheap ratio coincides with deteriorating margins and growing debt, the signal is better explained as a problem than as an attractive price. If it coincides with a stable business that the market ignores, the idea deserves deeper study. In both cases, the conclusion depends on what you find when you check, not on the initial number. Write down what you found for each signal, even when it contradicts your first idea.
Screening produces candidates, not decisions
The output of a screen is a list of candidates, nothing more. A candidate deserves research: reading the financial statements, understanding how the business earns money, reviewing its risks, and asking what would have to happen for your thesis to fail.
Do not delegate that last part either. A ranking from analysts, a commentator's recommendation or the result of a tool can be useful sources, but it is worth asking what interests sit behind each one. Having your own judgment does not mean ignoring other people. It means being able to explain, in your own words, why you trust or do not trust an idea.
Write your thesis in one sentence and keep it next to the analysis. Months from now, that note will tell you whether your reasoning was sound, even if the price did something else in the short term.
Three steps to filter with judgment
- Write the question. Define the size, liquidity and type of valuation you want before opening the screener.
- Combine at least three filters from different families. For example, valuation, liquidity and trend. Note why each filter is there and what result you expect from it, so you can later compare what happened with what you thought.
- Check each candidate against other signals. Before accepting an idea, look at profitability, margins, debt and an explanation for the low price. If you cannot find that explanation, the idea does not pass the filter, even if the initial numbers look good.
The last filter is you
When you finish filtering, you will have a few names and plenty of work ahead. That work is what turns a list into a decision of your own. No indicator replaces reading the business, and no outside recommendation replaces your responsibility for what you buy. The screen tells you where to look; the decision is still yours.
The goal of this method is not to find the perfect opportunity, because it does not exist. It is to build a process you can repeat, review and improve every time the market teaches you something new.
If you want to practice this process step by step, review the program Fundamentos de Research para Trading (Fundamentals of Research for Trading).
Educational content. Cronoss is not a broker, investment firm or financial adviser, and nothing above is an investment recommendation.
Frequently asked questions
What is stock screening?
Screening is a filter that reduces a large list of stocks or ETFs to a few candidates based on criteria you define. It helps organize the search but does not decide for you. Each candidate still requires research.
Why is one indicator not enough to filter?
Each indicator measures one side of an asset: valuation says nothing about liquidity, and trend says nothing about the business. Combining filter families reduces the risk of relying on one misleading number. Even so, the combined list still needs human review.
What does a low price to book ratio mean?
A price to book ratio below 1 means the market pays less than the accounting equity per share. It can point to a real problem or to a valuation error, so it is not enough as a buy signal. Check profitability, margins and debt before drawing a conclusion.
How do I know if a candidate deserves more study?
A candidate deserves study when the filters that selected it have a clear reason and other signals support it. If profitability, margins or debt contradict the idea, it is better to discard it. The final decision should be explainable in your own words.


