Key takeaways
- Price comes from supply and demand; value depends on what the business generates going forward.
- Book value only describes a company in liquidation; a going concern is worth its accounting plus future benefits.
- There are two paths to valuation: bring future cash flows to the present with a discount rate, or compare with multiples of similar companies.
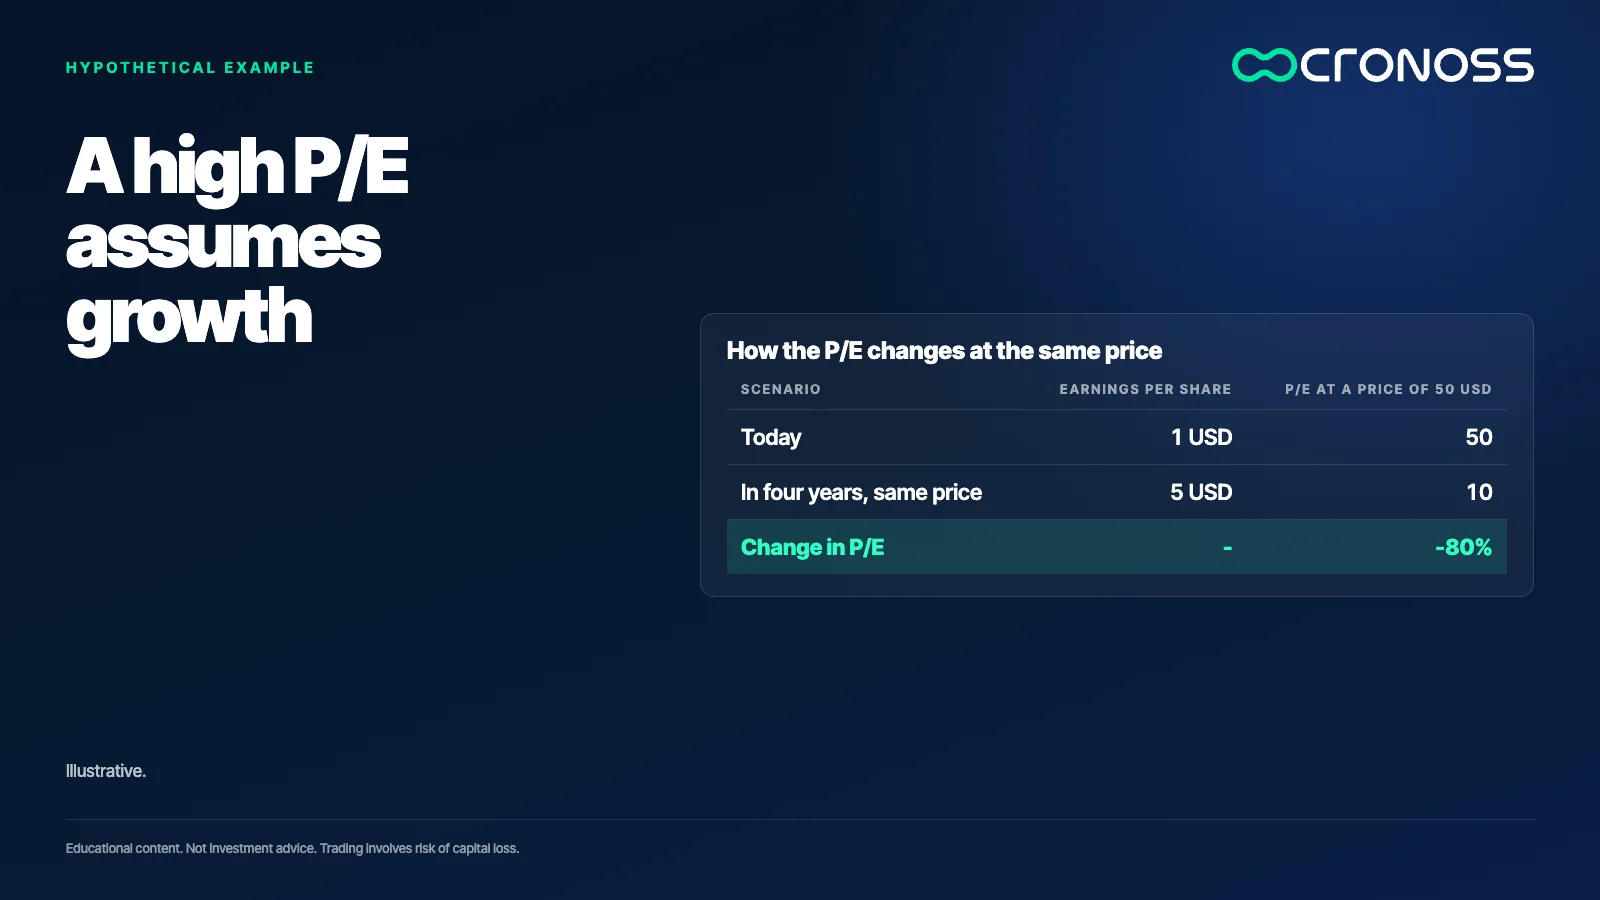
- A high multiple reflects growth expectations: with the same price and earnings five times larger, a P/E of 50 becomes 10.
- If methods give mixed signals, the company may be at a fair price; a margin of safety protects against estimation error.
"That stock is expensive." "That other one is cheap." These are phrases you hear every day in any conversation about the stock market. Rarely does anyone explain expensive compared to what, or cheap according to whom. Behind those words there are two concepts that are often confused: price and value.
Telling them apart is the starting point of fundamental analysis. Price is what the market pays today. Value is what a business produces and will produce. Sometimes they match, and often they do not.
Price is set by buyers and sellers from their expectations, value depends on what the business generates going forward, and fundamental analysis consists of estimating that gap with method and humility.
Price and value are not the same
A stock's price comes from supply and demand. It changes every time someone buys or sells. The value of the company is something else: what it is worth as a business, given what it owns and what it can produce.
A first intuitive idea is to look at the accounting: the balance sheet shows equity, you divide it by the number of shares and get a book value. That works if the company were to be liquidated tomorrow. But almost no company is a liquidation candidate: it is a going concern. A going concern is worth what its accounting says plus the future benefits it is expected to produce. That is why book value almost never matches the market price.
That discrepancy between price and value has been debated for decades in academia and in the markets, and has been approached with many methodologies. All of them start from the same question.
Why price moves so much
In the short term, price responds to expectations. A piece of news can change what is expected, and the price adjusts at once, even if the facts behind it have not yet been confirmed. That is why price sometimes rises on an announcement while the real data takes time to follow, or never does.
Investor Howard Marks explains it in Mastering the Market Cycle: the volatility of market prices is much greater than that of companies' profits or sales. That difference is what opens opportunities. A price can drift away from what is reasonable in one direction or the other. But taking advantage of it requires a tool to know whether something is expensive or cheap, because without one you are only guessing.
First path: bring future cash flows to the present
There are many valuation models, and almost all boil down to two paths. The first is easy to grasp with an apartment bought to rent out.
If you buy that apartment, you receive rent every month. You subtract building fees, taxes and other costs, and you are left with net income. That income will repeat throughout the useful life of the property. To know what it is worth today, you have to bring all those future flows to the present with a discount rate, because a dollar 20 years from now is worth less than a dollar today: there is inflation and there is an opportunity cost, because that money could be doing something else.
An illustrative, much simplified example: net income of USD 12,000 a year that continues indefinitely, discounted at 8%, is worth 12,000 / 0.08 = USD 150,000. If the apartment is offered at USD 200,000, the price is above that estimated value. If the discount rate or the projected income changes, the result changes, which is why this path requires explicit assumptions.
With a company it is the same: its value is what the set of flows it is expected to generate is worth, discounted to today.
Second path: compare it with others
The second path is more intuitive. Instead of projecting flows, you compare with similar assets. A 100 m² apartment is offered at USD 450,000, and another of 60 m² in the same complex costs USD 300,000. They cannot be compared directly because they differ in size, but they can by price per square meter: USD 4,500 for the first and USD 5,000 for the second.
That homogeneous measure is called a multiple. Several are used with companies:
- Price to earnings (P/E). How many monetary units are paid for each unit of profit.
- Price to sales. The same, against revenue.
- Price to book value. If the price equaled accounting equity, it would be 1. A value far above 1 indicates the market expects future benefits much larger than what the balance sheet shows today.
- Enterprise value to operating profit (EV/EBIT) or to EBITDA. They compare the total value of the business, including its debt, with its operating profit.
A high multiple is a growth expectation
A high P/E is read as "it is incredibly expensive" without further thought. But the multiple measures the current price against the profits you have today, and profits can grow.
An illustrative example. A stock trades at USD 50 and earnings per share are USD 1: the P/E is 50. If in four years earnings per share reach USD 5 and the price stays at USD 50, the P/E falls to 10, a drop of 80%. The price did not change, the earnings did. A high multiple means the market expects profits to grow a lot and fast. If that expectation is met, the multiple dilutes over time. If it is not, the current price was far above what the business justified.
Compare with peers and read mixed signals
A single multiple says little. It becomes useful when compared with similar companies: if most of its peers trade at a higher average multiple, the company looks cheap on that metric, and the reverse.
The problem is that no metric is better than all the others. A company can look cheap on P/E and expensive on price to book value or to sales. Those mixed signals are not a mistake: each multiple measures a different dimension. As with technical indicators, you look for several signals pointing the same way. When some say cheap and others say expensive, a reasonable conclusion is that it trades near a fair price.
And "fair price" does not mean "do not buy" or "buy": it means there is no clear discount to what it is estimated to be worth. That is why people talk about a margin of safety: since it is always possible to be wrong when estimating value, you look to buy at a discount that absorbs that error. It is Benjamin Graham's classic idea: not just a good company, but a good company at a good price.
Analyst price targets are estimates
Professional platforms show the price targets published by analysts at banks and brokerages. They are useful as context on what the consensus expects, but they are estimates with their own assumptions, not guarantees, and they change often. Nor do they replace your own analysis. A 12-month target speaks of a long horizon, and the actual path of the price can be very different.
Three questions before saying something is expensive or cheap
- Compared with what? Define whether you are talking about price against its estimated value, against its peers or against its own history.
- How many methods am I using? Use at least two, a discounted cash flow and a multiple, and always compare with similar companies.
- How much margin of safety do I leave? Assume your estimate may be wrong and decide how much error you are willing to accept.
Value is estimated, price is observed
Price is on the screen. Value has to be built from assumptions, which is why two serious analysts can reach different figures. Recognizing that is part of the method: no formula eliminates uncertainty, but organizing the reasoning avoids deciding out of enthusiasm or fear.
If you want to go deeper into these foundations, the program Fundamentos de las Finanzas (Fundamentals of Finance) develops them step by step.
Educational content. Cronoss is not a broker, investment firm or financial adviser, and nothing above is an investment recommendation.
Frequently asked questions
What is the difference between a stock's price and its value?
Price is what the market pays today and is set by supply and demand. Value is an estimate of what the business is worth based on what it owns and what it is expected to generate. They can match or differ widely.
How do you value a company?
There are two main paths: discount to the present the future cash flows it is expected to generate, or compare its price with similar companies through multiples such as price to earnings, sales or book value.
Does a high P/E mean a stock is expensive?
Not necessarily. A high P/E reflects that the market expects strong profit growth. If those profits grow, the multiple falls at the same price. If not, the price was above what the business justified.
What is a margin of safety?
It is buying at a discount to estimated value to absorb the chance of having been wrong in the estimate. It is a classic idea from Benjamin Graham: not just a good company, but a good company at a good price.